Figure 6.
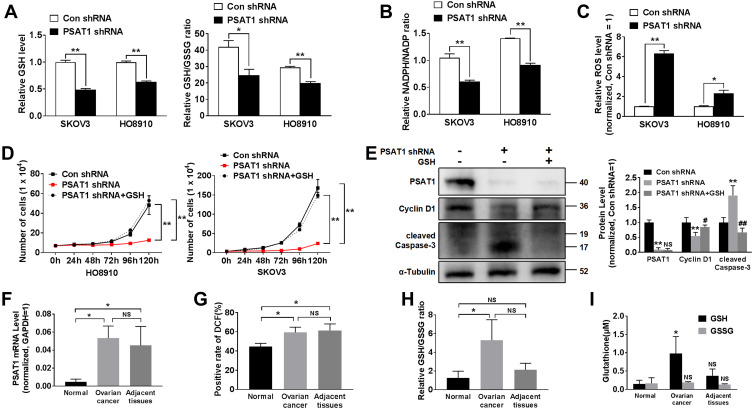
PSAT1 promotes the growth of EOC by regulating redox balance. (A) Glutathione (GSH) levels and the GSH/GSSG ratio were calculated in SKOV3 and HO8910 cells without or with stable PSAT1 knockdown (n = 3). T-test, **P < 0.01, *P < 0. 5. (B) The NADPH/NADP ratio was calculated in SKOV3 and HO8910 cells without or with stable PSAT1 knockdown (n = 3). T-test, **P < 0.01. (C) Cellular reactive oxygen species (ROS) levels were determined in SKOV3 and HO8910 cells without or with stable PSAT1 knockdown (n = 3). T-test, **P < 0.01, *P < 0.05. (D) Proliferation assays of PSAT1-knockdown SKOV3 and HO8910 cells in medium with or without supplemental GSH (n = 3). T-test, **P < 0.05 vs Con shRNA. (E) Western blot and histograms of PSAT1, Cyclin D1, cleaved Caspase-3, and α-Tubulin for PSAT1-knockdown SKOV3 cells with or without supplemental GSH. (n = 3). **P < 0.01 vs Con shRNA; #P < 0.05 vs PSAT1 shRNA, ##P < 0.01 vs PSAT1 shRNA. ANOVA with post hoc test. (F) PSAT1 mRNA levels in normal ovary, ovarian cancer, and adjacent tissue (n=3). ANOVA with post hoc test. *P < 0. 5. (G) Rate of intracellular ROS activation was monitored by DCF in normal ovary, ovarian cancer, and adjacent tissue (n=3). ANOVA with post hoc test. *P < 0. 5. (H) The GSH/GSSG ratio was calculated in normal ovary, ovarian cancer, and adjacent tissue (n=3). ANOVA with post hoc test. *P < 0. 5. (I) GSH and GSSG levels in normal ovary, ovarian cancer, and adjacent tissue (n=3). ANOVA with post hoc test. *P < 0. 5 vs normal. All error bars in panels are defined as SEM.
Abbreviation: NS, not significant.

