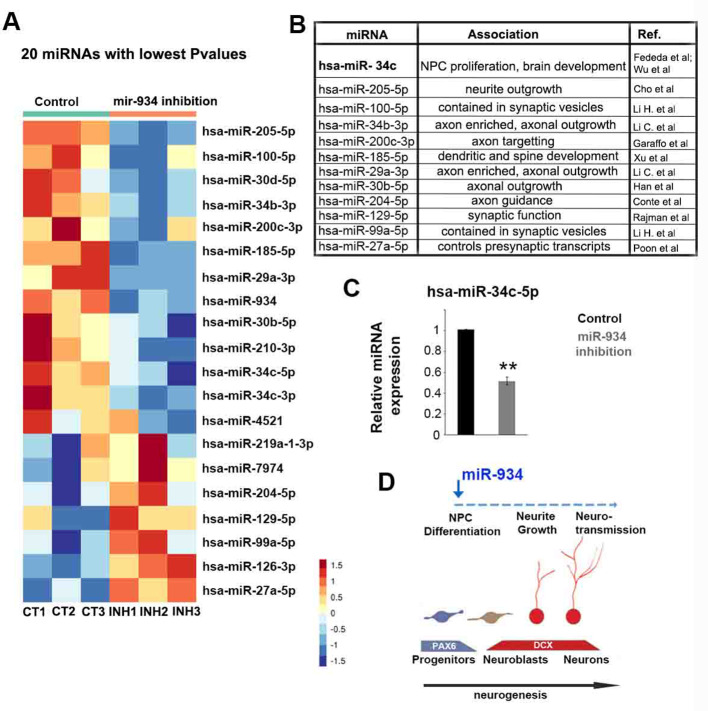
Figure 6. miRNA expression profiling following sustained inhibition of miR-934.
(A) Heatmap showing the 20 miRNAs with lowest p-values at differential expression analysis following miR-934 sustained inhibition. (B) Table describing the association of differentially expressed miRNAs with axon/dendrite development and/or synapse formation. miRNA associations taken from Fededa et al., 2016; Wu et al., 2014; Cho et al., 2013; Conte et al., 2014; Garaffo et al., 2015; Han et al., 2015; Li et al., 2019; Li et al., 2015; Poon et al., 2016; Rajman et al., 2017; Xu et al., 2013. (C) qRT-PCR showing downregulation of mir34c-5p following miR-934 sustained inhibition (scrambled control 1+0.005 vs miR934 inhibition 0.51+0.03, n = 3, p=0.005). Bars and error bars represent mean values and the corresponding SEMs; 0.001<**p<0.01. (D) Sketch depicting the neurogenic function of miR-934 also affecting subsequent neuronal differentiation processes as reflected in large-scale changes in the expression of genes and miRNAs associated with neurogenesis.

