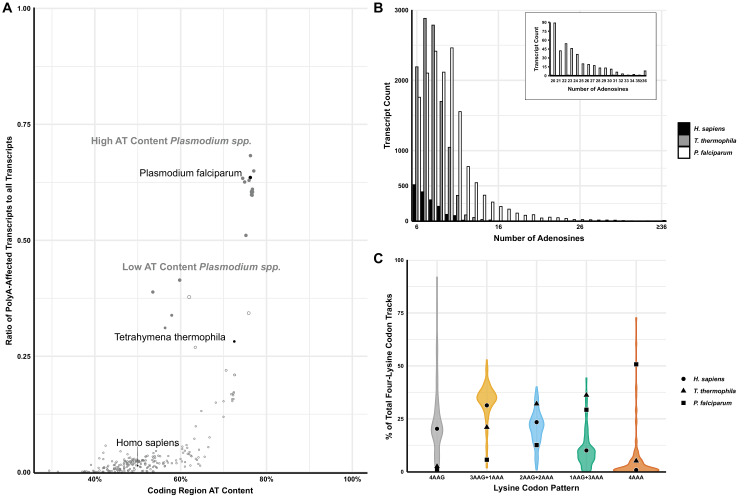
Figure 1. Analyses of polyA tracts in eukaryotic genomes.
(A) The plot of 152 species representing a comparison of the ratio of polyA-affected transcripts (over a total number of transcripts) to the AT content of the coding region for each organism. H. sapiens, T. thermophila, and P. falciparum, as organisms pertinent to this paper are in black. For reference, other model organisms of interest are displayed in gray, including a position of high (65% average) and low (35%) AT-content Plasmodium spp. (B) Transcript counts for genes with 6 to 36 consecutive adenosines for H. sapiens, T. thermophila, and P. falciparum. H. sapiens and T. thermophila are limited to a single transcript at length of ≤17 As. The longest P. falciparum 3D7 transcript reaches maximal 65As, with multiple transcripts of ≤36 As. (C) Violin plot of lysine codon usage distribution in tracts of four lysine residues for 152 organisms. 3AAG+1AAA, 2AAG+2AAA and 1AAG+3AAA indicate different ratios of AAG and AAA codons in runs of four consecutive lysine codons. 4AAG and 4AAA indicate poly-lysine runs with only AAG or AAA codons, respectively. H. sapiens (circle), T. thermophila (triangle), and P. falciparum (square) are specifically noted.


