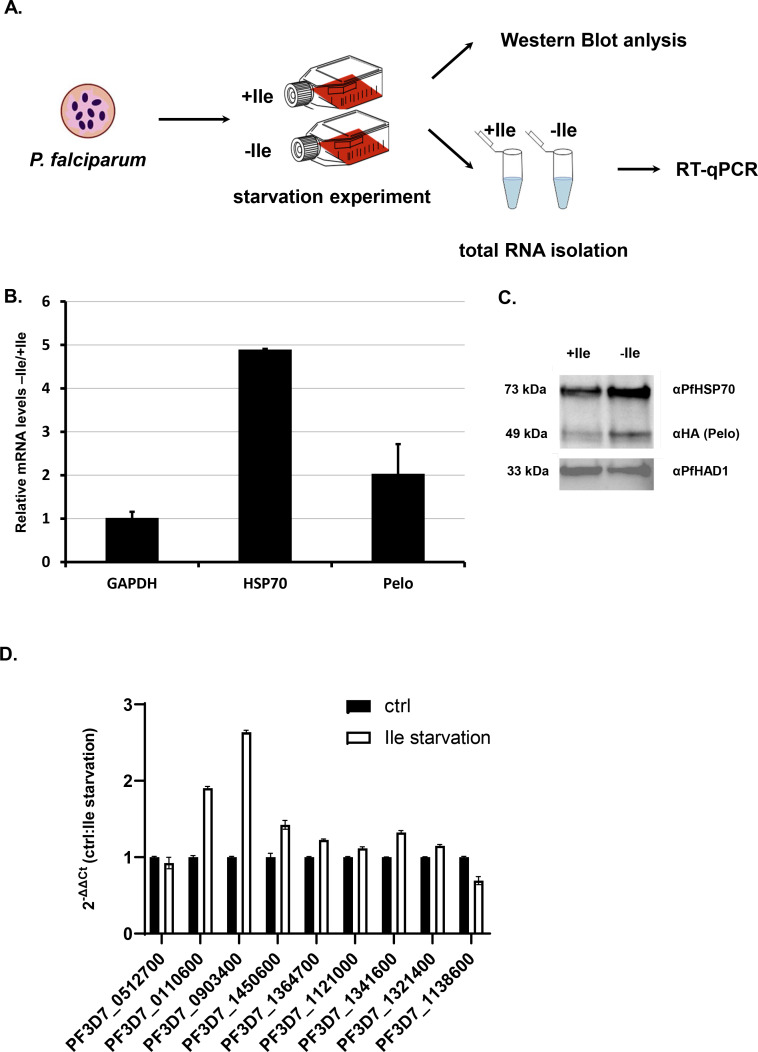
Figure 6. Isoluecine starvation in Plasmodium cells induces HSP70 and Pelo genes.
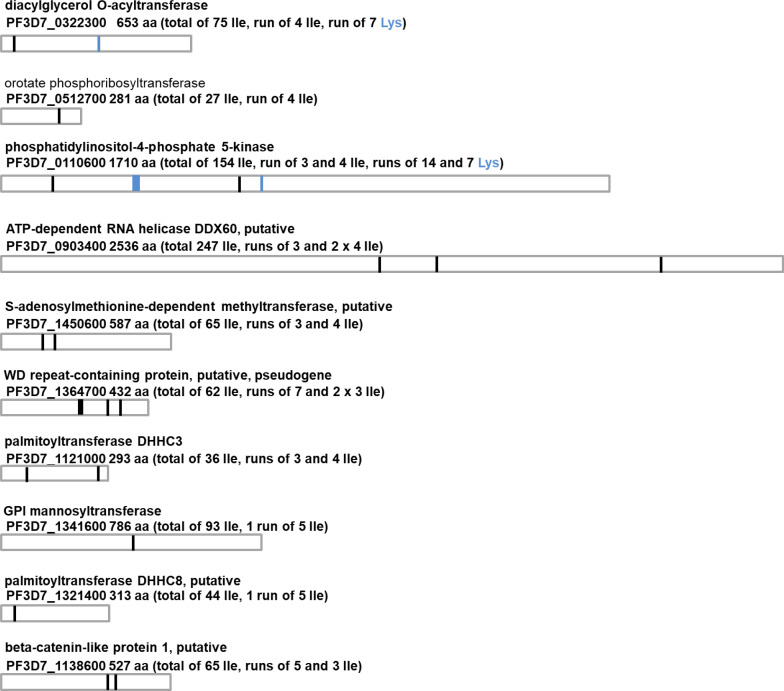
(A) The schematic presentation of the starvation experiment design. The cells were incubated for 48 hr in medium with and without Ile (+ / - Ile). After 48 hr samples were collected and protein and total RNA was isolated. (B) Relative mRNA of P. falciparum GAPDH (PF3D7_1462800), HSP70 (PF3D7_0818900), Pelo (PF3D7_0722100) transcripts after 48 hr isoleucine (Ile) starvation of the P. falciparum cells. Levels of each transcript are normalized to total GAPDH levels and represented as a ratio of transcript levels under Ile starvation (-Ile) over the control conditions (+Ile). In each case, data represent the mean value of three biological replicates with standard deviation. (C) Levels of P. falciparum HSP70 and Pelo proteins after 48 hr of Ile starvation. Western blot analysis of Ile starved (-Ile), and control (+Ile) sample are normalized to PfHAD1 (PF3D7_1033400) levels. HA-tagged P. falciparum Pelo protein was CRISPR/Cas9 engineered and detected using mouse HA-antibody. The molecular weight of each protein is indicated. (D) qRT-PCR measured mRNA levels of genes containing 3–7 Ile. PF3D7_0322300, PF3D7_0512700, PF3D7_0110600, PF3D7_0903400, PF3D7_1450600, PF3D7_1364700, PF3D7_1121000, PF3D7_1341600, PF3D7_1321400, PF3D7_1138600. Levels of each transcript are normalized to total GAPDH level and represented as a ratio of transcript levels under Ile starvation (-Ile) over the control conditions (+Ile). In each case, data represent the mean value of three biological replicates with standard deviation.


