. 2020 Jun 2;9:e50684. doi: 10.7554/eLife.50684

Figure 2. ADAM10 is important for Piezo1 regulation of NICD.

(a) ADAM10 enzyme activity assessed by specific peptide degradation and subsequent fluorescence emission after 30 min exposure of HMVEC-Cs to 10 dyn.cm−2 laminar shear stress (SS). Static was without SS. Cells were transfected with control siRNA (siCtrl) or Piezo1 siRNA (siPiezo1). Data are shown as mean ± SD data (n = 3) relative to static condition. (b) ADAM10 enzyme activity assessed after 30 min treatment of HMVEC-Cs with 0.2 µM Yoda1 in the absence or presence of 5 µM GI254023X (GI). Data are shown as mean ± SD data (n = 4) relative to DMSO condition. (c, d) Quantification of uncleaved (95 kDa) and cleaved (62–64 kDa) ADAM10 in HMVEC-Cs after treatment for 30 min with Yoda1 (0.2 µM). The 85 kDa band between the uncleaved and cleaved ADAM10 was non-specific labelling not related to ADAM10 (Figure 2—figure supplement 2). Data represent mean ± SD (n = 3) and normalization was to the reference protein, GAPDH. (e) Example Western blot labelled with anti-NICD and anti-GAPDH antibodies for HMVEC-Cs treated for 30 min with 0.2 µM Yoda1 or vehicle (DMSO) in the absence or presence of 5 µM GI254023X (GI). (f) Quantification of data of the type exemplified in (e), showing mean ± SD data for abundance of NICD normalized to DMSO (n = 3). (g) Representative Western blot labelled with anti-NICD and anti-GAPDH antibodies for HMVEC-Cs treated for 30 min with 0.2 µM Yoda1 or vehicle (DMSO) after transfection with control siRNA (siCtrl) or ADAM10 siRNA (siADAM10). (h) Quantification of data of the type exemplified in (g), showing mean ± SD data for abundance of NICD normalized to siCtrl DMSO (n = 3). Statistical analysis: Two-way ANOVA test was used for (a, b, f, h), indicating *p<0.05, **p<0.01, ***p<0.001; t-Test was used for (d), indicating **p<0.01; NS, not significantly different.

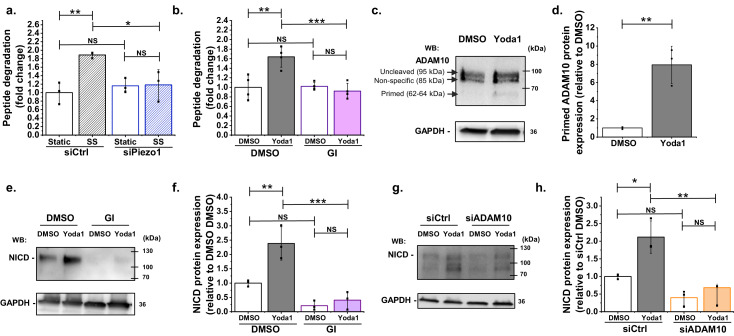
Figure 2—source data 1. Source data for Figure 2.

Figure 2.

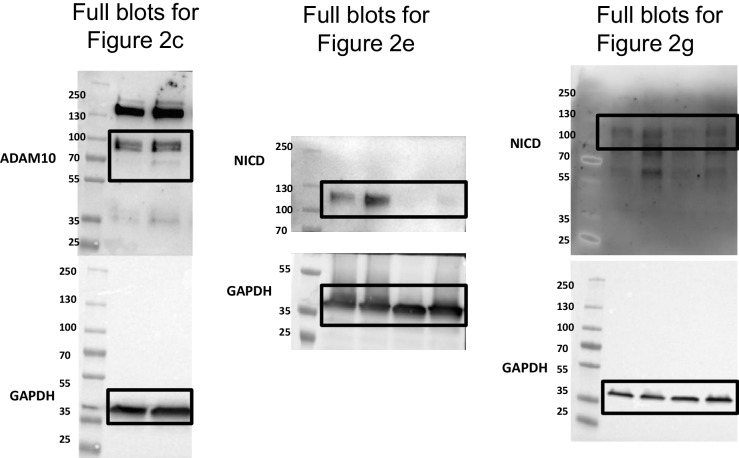
Figure 2—figure supplement 1. Uncropped western blots for Figure 2c, Figure 2e and Figure 2g.

Figure 2—figure supplement 1.

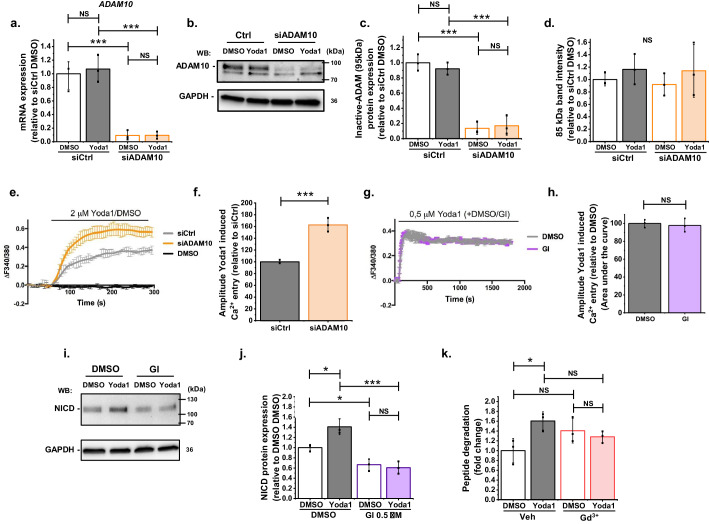
Figure 2—figure supplement 2. Additional supporting data for Figure 2.

Figure 2—figure supplement 2.

(a) Summarized mean ± SD (n = 3) quantitative PCR data for fold-change in ADAM10 mRNA in HMVEC-Cs treated for 2 hr with 0.2 µM Yoda1 or vehicle (DMSO) after transfection with control siRNA (siCtrl) or ADAM10 siRNA (siADAM10). (b) Representative Western blot labelled with anti-ADAM10 antibody for HMVEC-Cs treated for 30 min with 0.2 µM Yoda1 after transfection with control siRNA (siCtrl) or ADAM10 siRNA (siADAM10). (c, d) Quantification of data of the type exemplified in (b), showing mean ± SD data for abundance of uncleaved ADAM10 (95 kDa) (c) and non-specific labelling of an unknown protein (85 kDa) (d) normalized to siCtrl (n = 3). (e–f) Representative intracellular Ca2+ measurement traces (e) in HMVEC-Cs during application of 2 μM Yoda1 or its vehicle control (DMSO), 48 hr after transfection with control siRNA (siCtrl) or ADAM10 siRNA (siADAM10), shown as mean ± SD of the amplitude for n = 3 (f). (g–h) Representative intracellular Ca2+ measurement traces (g) in HMVEC-Cs during prolonged application of 0.5 μM Yoda1 or its vehicle control (DMSO) simultaneously with 5 µM GI254023X (GI) or its vehicle control (DMSO), shown as mean ± SD of the area under the curve for n = 3 (h). (i) Representative Western blot labelled with anti-NICD and anti-GAPDH antibodies for HMVEC-Cs treated for 30 min with 0.2 µM Yoda1 or vehicle (DMSO) in the absence or presence of 0.5 µM GI254023X (GI) (j) Quantification of data of the type exemplified in (i), showing mean ± SD data for abundance of NICD normalized to siCtrl DMSO (n = 3). (k) ADAM10 enzyme activity assessed by specific peptide degradation and subsequent fluorescence emission after 30 min treatment of HMVEC-Cs with 0.2 µM Yoda1 in the absence or presence of 30 µM Gd3+. Data are shown as mean ± SD data (n = 3) relative to vehicle condition. Statistical analysis: Two-way ANOVA test was used for (a, c, d, j, k), indicating *p<0.05, **p<0.01 and ***p<0.001. T-test was used for (f, h), indicating ***p<0.001. NS indicates no significant difference.
Figure 2—figure supplement 2—source data 1. Source data for Figure 2—figure supplement 2.
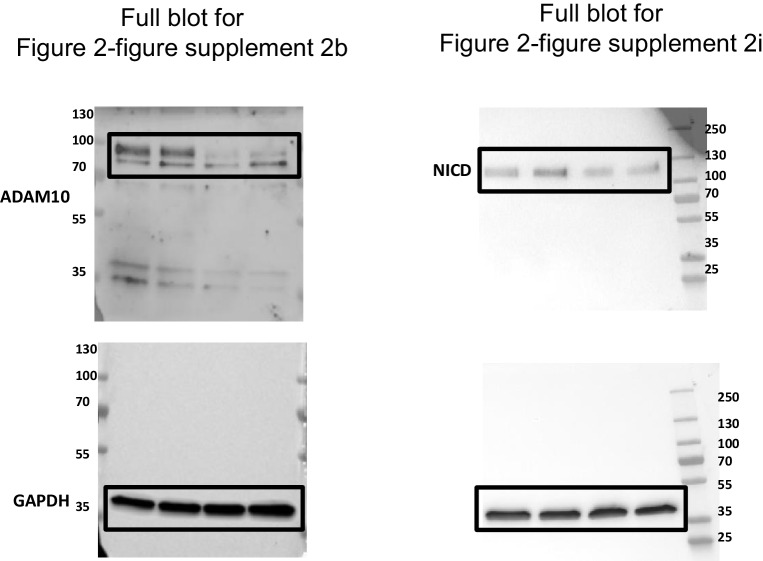
Figure 2—figure supplement 3. Uncropped western blots for Figure 2—figure supplement 2b and Figure 2—figure supplement 2i.

Figure 2—figure supplement 3.