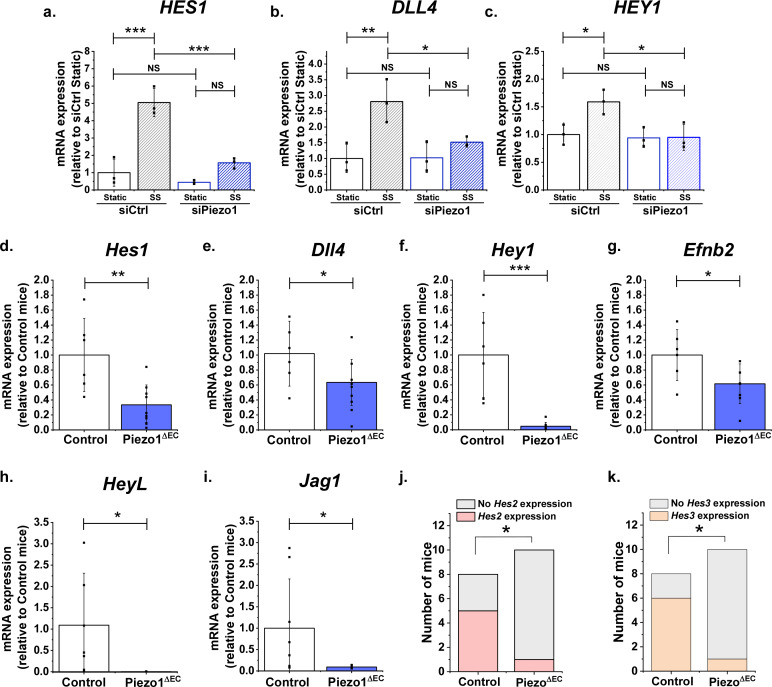
Figure 4. Endothelial Piezo1 is required for the gene expression of Notch1 targets in HMVEC-C exposed to shear stress and in mouse liver endothelial cells.
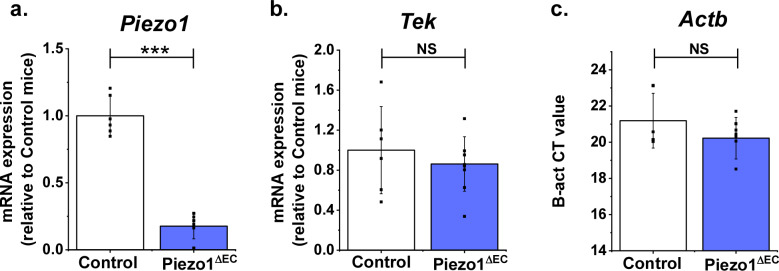
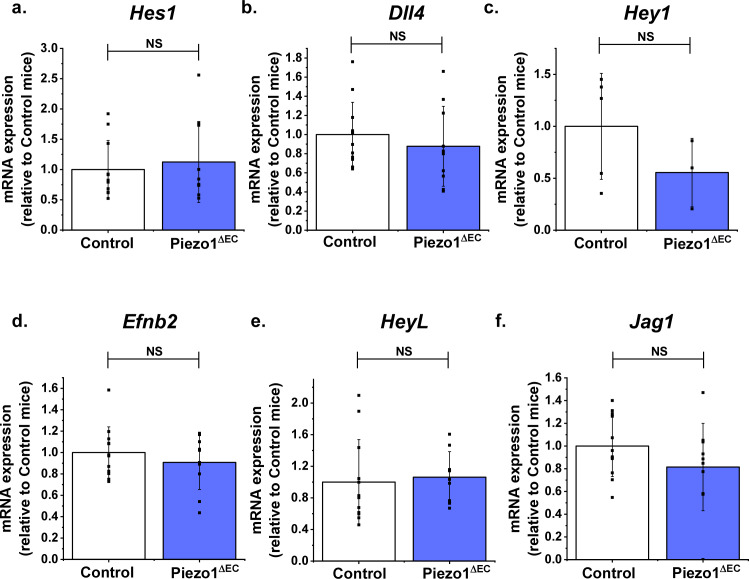
(a, b, c) Summarized mean ± SD (n = 3) quantitative PCR data for fold-change in HES1 (a), DLL4 (b) and HEY1 (c) mRNA in HMVEC-Cs exposed to 10 dyn.cm−2 laminar shear stress (SS) for 2 hr after transfection with control siRNA (siCtrl) or Piezo1 siRNA (siPiezo1). Hes1 (d), Dll4 (e), Hey1 (f) and Efnb2 (g) mRNA expression in liver endothelial cells freshly-isolated from control mice (Control, n = 6) and endothelial Piezo1 knockout mice (Piezo1ΔEC) (n = 9). HeyL (h) (Control mice, n = 7; Piezo1ΔEC mice, n = 7) and Jag1 (i) (Control mice, n = 8; Piezo1ΔEC mice, n = 9) mRNA expression in liver endothelial cells. Normalization and Statistical analysis: mRNA expression was normalized to abundance of Actb mRNA, which was not different between Control and Piezo1ΔEC (Figure 4—figure supplement 2). Hes2 (j) and Hes3 (k) mRNA expression in liver endothelial cells freshly-isolated from control mice (Control, n = 8) and Piezo1ΔEC mice (n = 10), represented as the number of mice with detectable expression or no detectable expression of the gene. Statistical analysis: Two-way ANOVA test was used for (a, b, c), indicating *p<0.05, **p<0.01, ***p<0.001. t-Test was used for (d, e, f, g, h, i) indicating significant difference of Piezo1ΔEC cf Control *p<0.05, **p<0.01, ***p<0.01. Fisher’s exact test was used for (j, k) indicating significant difference of Piezo1ΔEC cf Control *p<0.05. NS indicates not significantly different.


