Fig. 5.
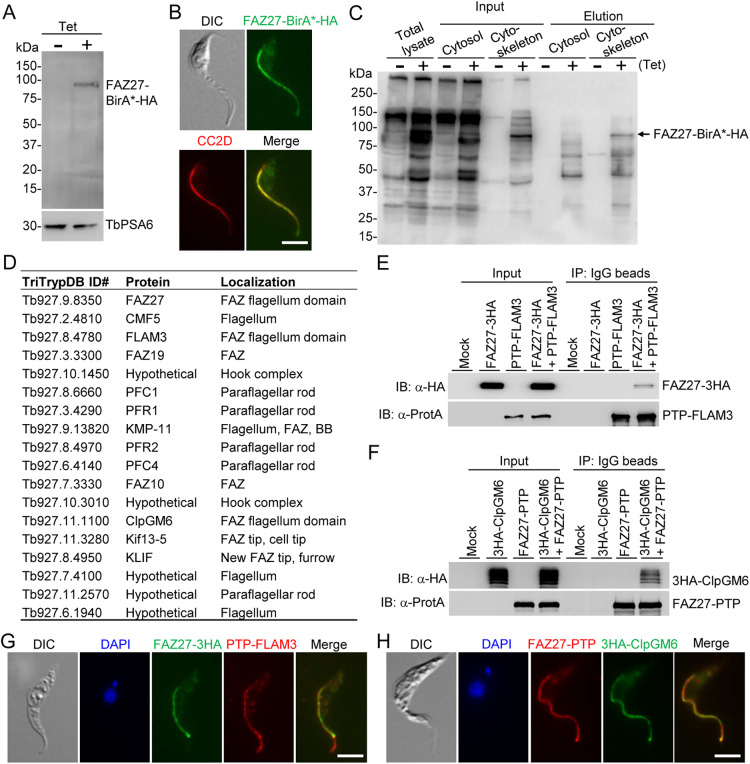
Proximity-dependent biotin identification and co-immunoprecipitation identified FLAM3 and ClpGM6 as FAZ27-interacting proteins. (A) Western blotting to detect the expression of FAZ27–BirA*–HA in procyclic trypanosomes. FAZ27–BirA*–HA was detected with anti-HA antibody, and TbPSA6 served as the loading control. (B) Immunofluorescence microscopy to detect the subcellular localization of FAZ27–BirA*–HA. Cells were immunostained with FITC-conjugated anti-HA antibody and anti-CC2D antibody. Scale bar: 5 μm. (C) Western blotting with anti-streptavidin antibody to monitor the purification of biotinylated proteins in close proximity to FAZ27–BirA*–HA. (D) List of proteins identified by FAZ27 BioID that localize to the vicinity of FAZ27. (E) Co-immunoprecipitation to test the interaction between FAZ27 and FLAM3. PTP–FLAM3 and FAZ27–3HA were co-expressed from their respective endogenous loci. Cells expressing FAZ27–3HA or PTP–FLAM3 alone served as controls. PTP–FLAM3 was detected by anti-Protein A (α-ProtA) antibody, and FAZ27–3HA was detected by anti-HA antibody. (F) Co-immunoprecipitation to test the interaction between FAZ27 and ClpGM6. FAZ27–PTP and 3HA–ClpGM6 were co-expressed from their respective endogenous loci. Cells expressing FAZ27–PTP or 3HA–ClpGM6 alone served as controls. FAZ27–PTP was detected by anti-Protein A (α-ProtA) antibody, and 3HA–ClpGM6 was detected by anti-HA antibody. (G) Co-immunofluorescence microscopy to detect the colocalization between FAZ27 and FLAM3. FAZ27–3HA was detected by FITC-conjugated anti-HA antibody, and PTP–FLAM3 was detected by anti-Protein A antibody. Cells were counterstained with DAPI to stain nuclear and kinetoplast DNA. Scale bar: 5 μm. (H) Co-immunofluorescence microscopy to detect the colocalization between FAZ27 and ClpGM6. FAZ27–PTP was detected by anti-Protein A antibody, and 3HA–ClpGM6 was detected by FITC-conjugated anti-HA antibody. Cells were counterstained with DAPI to stain nuclear and kinetoplast DNA. Scale bar: 5 μm. Blots shown in A,C,E,F are representative of three experiments, and images in B,G,H are representative of three experiments.

