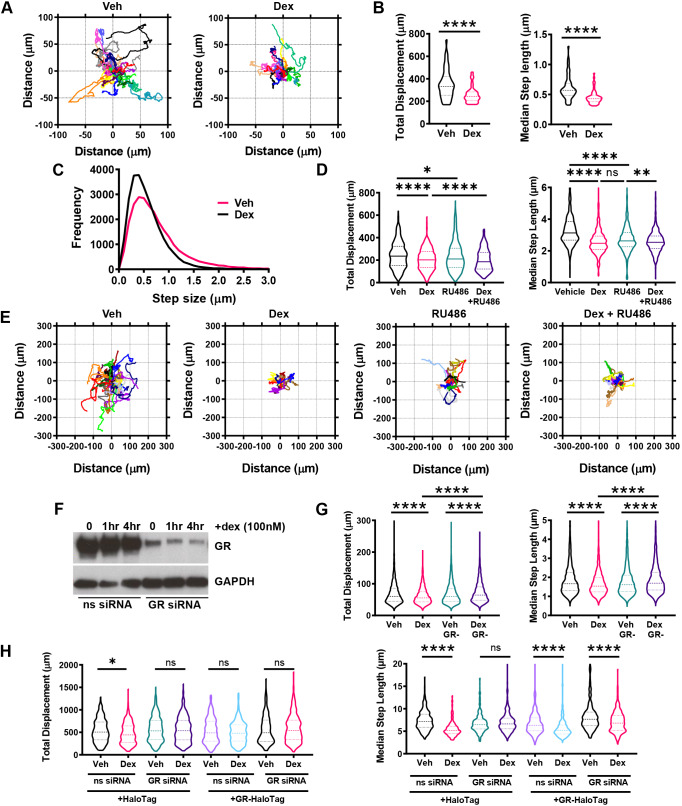
Fig. 1.
GR agonists and antagonists inhibit cell migration. (A–C) Cell migration data for A549 cells that were transiently transfected with 0.5 µg pBOS-H2B-GFP and incubated for 24 h at 37°C/5% CO2 prior to imaging. Cells were treated with vehicle (Veh; DMSO) and dexamethasone (dex; 100 nM) and images acquired every 5 min for 48 h. Data displayed represents the first 24 h of tracking. (A) Rose plots of A549 cell displacement (µm) in response to 24 h of vehicle and dex (100 nM) treatment. Each coloured line represents the displacement of one cell from its point of origin. Each rose plot is representative of 20 randomly chosen A549 cells. (B) Violin plots of total displacement (µm; the overall distance moved by every cell tracked) and median step length (µm; the median of all the distances move by a cell between each image acquisition over the entire duration of tracking) for A549 cells in response to 24 h of vehicle and dex (100 nM) treatment. Migration data is representative of 52 individual cells for vehicle treatment and 54 individual cells for dex treatment, across two independent experiments. Dashed lines represent the median±interquartile range (IQR) (unpaired t-test; ****P<0.0001). (C) Frequency distribution curves of all A549 cell step lengths (µm) in response to 24 h of vehicle and dex (100 nM) treatment. (D,E) Cell migration data for A549 cells that were tracked using brightfield microscopy. Cells were treated with vehicle (DMSO) and dex (100 nM) and images acquired every 10 min for 24 h, with data displaying all 24 h of tracking. (D) Violin plots showing the total displacement (µm) and median step length (µm) of A549 cells in response to 24 h of vehicle, dex (100 nM), RU486 (100 nM), and dex+RU486 (both 100 nM) co-treatment. Migration data is displayed as the median±IQD and represents all cells analysed over three independent experiments (Kruskal–Wallis non-parametric test followed by Dunn's multiple comparisons test; *P=0.0342, **P=0.0076, ****P<0.0001). (E) Rose plots of A549 cell displacement (µm) in response to 24 h of dex (100 nM), RU486 (100 nM), RU486 (100 nM), and a dex+RU486 (both 100 nM) co-treatment. Each coloured line represents the displacement of one cell from its point of origin. Each rose plot is representative of 20 randomly chosen A549 cells. (F) Western blot of GR and GAPDH protein expression in control (non-silencing siRNA-treated) and GR knockdown (GR siRNA#6-treated) A549 cells in response to 1 and 4 h of vehicle and dex (100 nM) treatment. siRNA treatments were performed over 48 h. Western blot image is representative of two independent experiments. (G) Cell migration data for A549 cells that were tracked using brightfield microscopy. Cells were transiently transfected with siRNA targeting GR or a non-targeting siRNA negative control for 48 h. GR-knockdown cells were then treated with vehicle (DMSO) or dex (100 nM) and images acquired every 10 min for 6 h, with data displaying all 6 h of tracking. Violin plots of total displacement (µm) and median step length (µm) of control and GR knockdown A549 cells in response to 6 h of vehicle and dex (100 nM) treatment. Migration data shown as median±IQD and represents all cells analysed over three independent experiments (Kruskal–Wallis non-parametric test followed by Dunn's multiple comparisons test; ****P<0.0001). (H) Cell migration data for A549 cells that were tracked using fluorescence microscopy based on Rhodamine expression. GR-knockdown cells were transiently transfected with HaloTag empty vector (2 µg) or HaloTag–GR (2 µg) for 24 h and then treated with vehicle (DMSO) or dex (100 nM) for 24 h. Cells were labelled overnight with HaloTMRDirect ligand (100 nM) that labels HaloTag proteins with the Rhodamine fluorophore. Images were acquired every 10 min, with data displaying 24 h of tracking. Violin plots of total displacement (µm) and median step length (µm) of control and GR knockdown A549 cells overexpressing 2 µg empty-pHaloTag control or 2 µg HaloTag-GR in response to 24 h of vehicle or dex (100 nM) treatment. GR knockdown was siRNA-mediated over 48 h, alongside a non-silencing siRNA negative control. Migration data as the median±IQD and represents all cells analysed over three independent experiments (Kruskal–Wallis non-parametric test followed by Dunn's multiple comparisons test; *P=0.0159, ****P<0.0001). ns, not significant.

