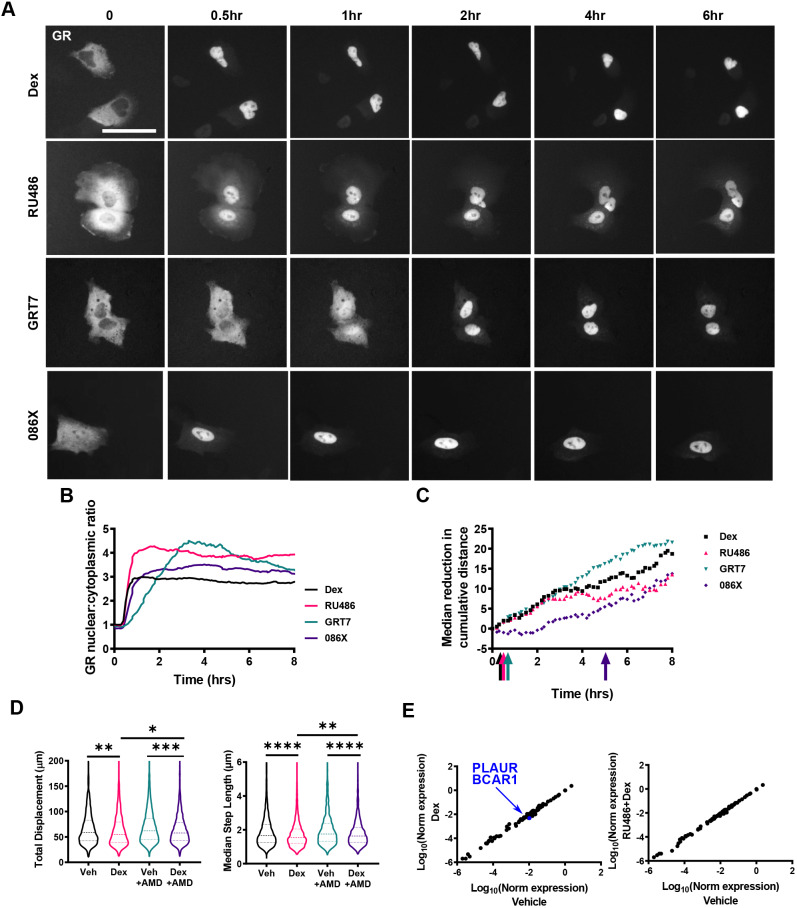
Fig. 3.
Ligand-specific regulation of migration kinetics. (A) Representative widefield images of HaloTag–GR nuclear accumulation in A549 cells over 6 h of dex (100 nM), RU486 (100 nM), GRT7 (3 nM), and 086X (100 nM) treatment. A549 cells were transiently transfected with 250 ng HaloTag–GR and labelled with Halo®TMRDirect™ ligand (100 nM). Images are representative of three independent experiments. (B) Nuclear:cytoplasmic ratio of GR localisation in response to potency-matched treatment of dex (100 nM), RU486 (100 nM), GRT7 (3 nM) and 086X (100 nM) over 8 h. GR localisation was quantified using ImageJ. (C) Non-parametric rank-sum test of A549 cell migration (cumulative distance) signifying the earliest timepoint (coloured arrows) at which migration is statistically different [P<0.05; Mann–Whitney U (Wilcoxon rank sum) test] in response to dex (100 nM), RU486 (100 nM), GRT7 (3 nM), and 086X (100 nM) compared to vehicle-treated controls. (D,E) Cell migration data for A549 cells that were tracked using brightfield microscopy. Cells were pre-treated for 1 h with vehicle (DMSO) or actinomycin D (1 µg/ml) before treating with vehicle (DMSO) or dex (100 nM), and images were acquired every 10 min for 4 h, with data displaying all 4 h of tracking. (D) Violin plots of total displacement (µm) and median step length (µm) of A549 cells in response to 1 h pre-treatment with vehicle or actinomycin D (1 µg/ml) and subsequent 4 h treatment with vehicle or dex (100 nM). Migration data shown as the median±interquartile range (IQR; dashed lines) and represents all cells analysed over two independent experiments (Kruskal–Wallis non-parametric test followed by Dunn's multiple comparisons test; *P=0.01, **P<0.004, ***P=0.0001, ****P<0.0001). (E) RT2 qPCR array of genes that regulate cell migration in response to 4 h of dex (100 nM), and a dex plus RU486 (both 100 nM) co-treatment. Each data point represents an individual gene. Values on the scatter plot represent log10 (normalised expression). Genes in black have a fold change over the vehicle control less than 2 and greater than 0.5. Genes with a fold change less than 0.5 (downregulated) are indicated in blue.

