Fig. 4.
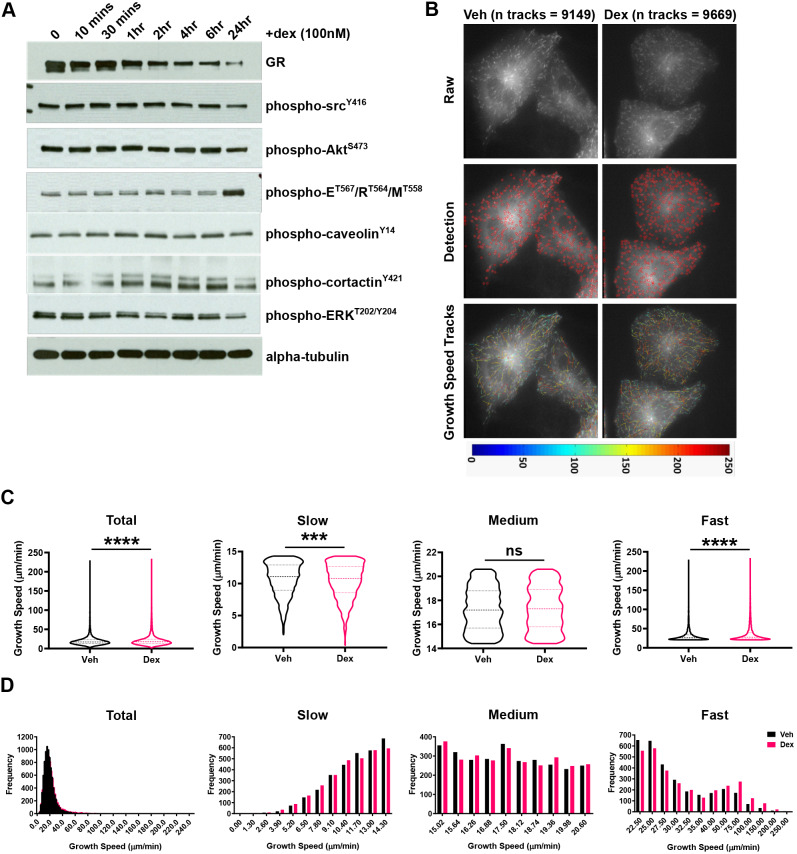
Glucocorticoids stabilise the microtubule network. (A) Western blot of total GR, phospho-SrcY416, phospho-AktS473, phospho-EzrinT567/RadixinT564/MoesinT558 (E/R/M), phospho-caveolinY14, phospho-cortactinY421, phospho-ERKT202/Y204 and total α-tubulin protein expression in response to dex (100 nM) as a time series (0, 10 min, 30 min, 1 h, 2 h, 4 h, 6 h, and 24 h). Western blots are representative of three independent experiments. (B) Representative images of A549 cells transiently transfected with EB3–GFP over 24 h and then treated with vehicle (Veh; DMSO) and dex (100 nM) for 4 h. Cells were selected at random based on expression of EB3–GFP and then microtubule comets (microtubule plus-ends expressing EB3–GFP) were imaged every 0.5 s for 60 s (total 120 images acquired; top panel). Microtubule dynamics were determined from the 60 s EB3–GFP time series using plusTipTracker software (MATLAB; middle and bottom panels). Fluorescently labelled microtubule plus-ends were first detected (middle panel) and then microtubule growth events were tracked (bottom panel), and dynamics determined. Tracks are represented by a colour-coded heat map (indicating growth speed μm/min) imposed upon the raw image (bottom panel). (C) Violin plots of microtubule growth speed (µm/min) in A549 cells following a 4 h vehicle and dex (100 nM) treatment. Growth speed data is shown entirely (upper left panel; total) or split into tertiles according to speed (designated slow, medium or fast). Each bin size corresponds to one-third of all growth speed events following vehicle treatment, and was applied to the dex-treated data set. Data is representative of three independent experiments (n=3); 9149 (vehicle-treated) and 9669 (dex-treated) growth events, from 10 cells per condition were tracked and analysed. Results are median±interquartile range (dashed lines; Mann–Whitney non-parametric test; ***P=0.0002, ****P<0.0001; ns, not significant). (D) Histograms displaying the frequency of microtubule growth speeds (µm/min) in A549 cells following a 4 h vehicle and dex (100 nM) treatment. Growth speed data is shown entirely (upper left panel; total) or split into tertiles as described in C. Data for vehicle-treated cells is indicated by red bars and for dex-treated cells by blue bars.

