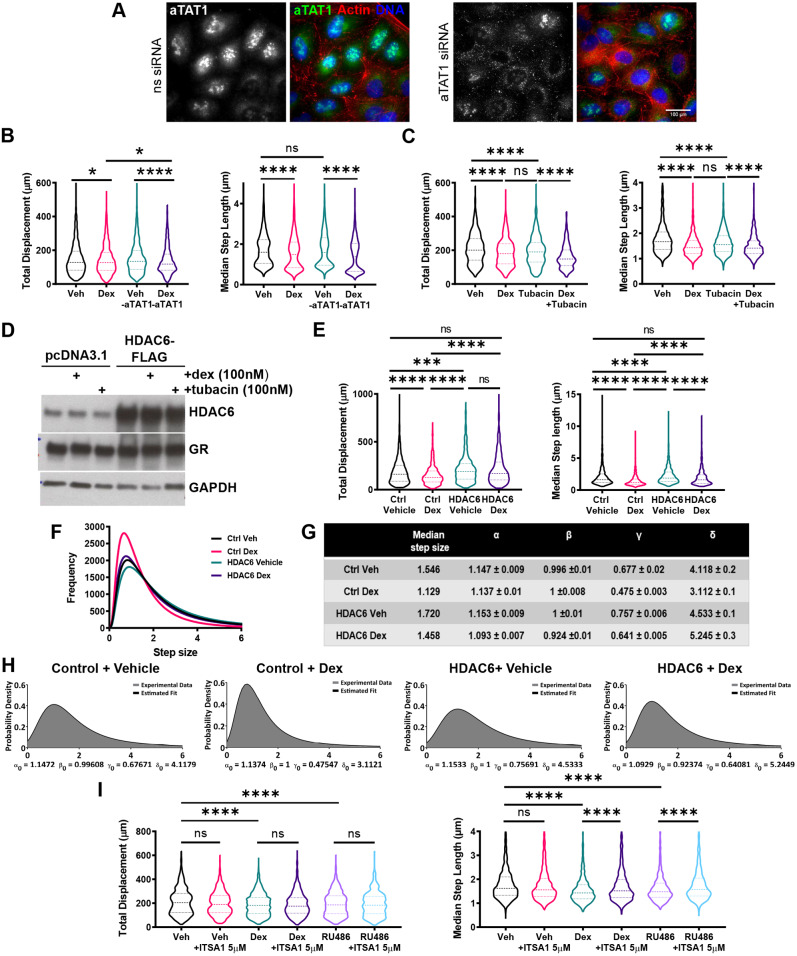
Fig. 5.
GC inhibits HDAC6 to regulate cell migration. (A) Representative images of control and αTAT1-knockdown A549 cells stained via immunofluorescence for αTAT1 (green) and F-actin (red). Nuclei were stained with DAPI (blue). αTAT1-knockdown was siRNA mediated over 48 h, alongside a non-silencing siRNA (ns siRNA) negative control. Images are representative of three independent experiments. Widefield images were acquired on a Delta Vision RT (Applied Precision, GE Healthcare) restoration microscope at 20× magnification. (B) Cell migration data for A549 cells that were tracked using brightfield microscopy. Cells were transiently transfected with siRNA targeting αTAT1 or a non-targeting siRNA negative control for 48 h. Images were acquired every 10 min, with data displaying all 24 h of tracking. Violin plots of total displacement (µm) and median step length (µm) of control and αTAT1 knockdown A549 cells in response to 24 h of vehicle and dex (100 nM) treatment. Migration data shown as median±interquartile range (IQR; dashed lines) and represents all cells analysed over two independent experiments (Kruskal–Wallis non-parametric test followed by Dunn's multiple comparisons test; *P<0.003; ****P<0.0001). (C) Cell migration data for A549 cells that were tracked using brightfield microscopy. Images were acquired every 10 min, with data displaying all 24 h of tracking. Violin plots of total displacement (µm) and median step length (µm) of A549 cells in response to 24 h of vehicle, dex (100 nM), tubacin (100 nM), and dex plus tubacin (both 100 nM) co-treatment. Migration data shown as median±IQR and represents all cells analysed over two independent experiments (Kruskal–Wallis non-parametric test followed by Dunn's multiple comparisons test; ****P<0.0001). (D) Western blot of HDAC6 and GR protein expression in A549 cells transiently transfected with pcDNA3.1 (empty vector control) or HDAC6–FLAG and treated with 1 h of vehicle, dex (100 nM) or tubacin (100 nM). Western blot is representative of two independent experiments. (E) Cell migration data for A549 cells that were tracked using fluorescence microscopy based on GFP expression. Cells were transiently co-transfected with H2B–GFP (0.25 µg) and HDAC6–FLAG (0.25 µg) for 24 h. Cells were then treated with vehicle (DMSO) or dex (100 nM), and images were acquired every 10 min for 24 h, with data displaying 24 h of tracking. Violin plots of total displacement (µm) and median step length (µm) of control (H2B–GFP) and HDAC6 overexpressing (H2B–GFP+HDAC6–FLAG) A549 cells in response to 24 h of vehicle and dex (100 nM) treatment. Migration data shown as median±IQR and represents all cells analysed over two independent experiments (Kruskal–Wallis non-parametric test followed by Dunn's multiple comparisons test; ***P=0.0004, ****P<0.0001). (F) Frequency distribution curves of all A549 cell step lengths (µm) in cells overexpressing empty control vector or HDAC6, in response to vehicle and dex (100 nM) treatment. (G) Estimated mean±s.d. α-stable distribution parameters of A549 cells overexpressing empty control vector or HDAC6 in response to vehicle and dex (100 nM) treatment. α-Stable parameters were derived by analysing experimentally determined step length data in MATLAB. Parameters estimated were for media step length (µm), stability exponent (α), skewness (β), scale (γ) and location (δ). Standard deviation estimates were generated by parameterising 100 randomly sampled subsets of the 15,000 values from the original data sets. (H) Probability density function (PDF) plots of experimental step length data (black line) and PDF plots generated from estimated α-stable distribution parameters (dark grey) in response to vehicle and dex (100 nM) treatment. Plots generated in MATLAB. (I) Cell migration data for A549 cells that were tracked using fluorescence microscopy based on GFP expression. Cells were treated with vehicle (DMSO) or ITSA1 (5 µM) in combination with vehicle (DMSO), dex (100 nM) or RU486 (100 nM) for 24 h. Images were acquired every 10 min for 24 h, with data displaying 24 h of tracking. Violin plots of total displacement (µm) and median step length (µm) of A549 cells in response to 24 h vehicle, dex (100 nM), RU486 (100 nM), ITSA1 (5 µM)+vehicle co-treatment, ITSA1 (5 µM)+dex (100 nM) co-treatment, and ITSA1 (5 µM)+RU486 (100 nM) co-treatment. Migration data shown as median±IQR and represents all cells analysed over two independent experiments (Kruskal–Wallis non-parametric test followed by Dunn's multiple comparisons test; ****P<0.0001). ns, not significant.

