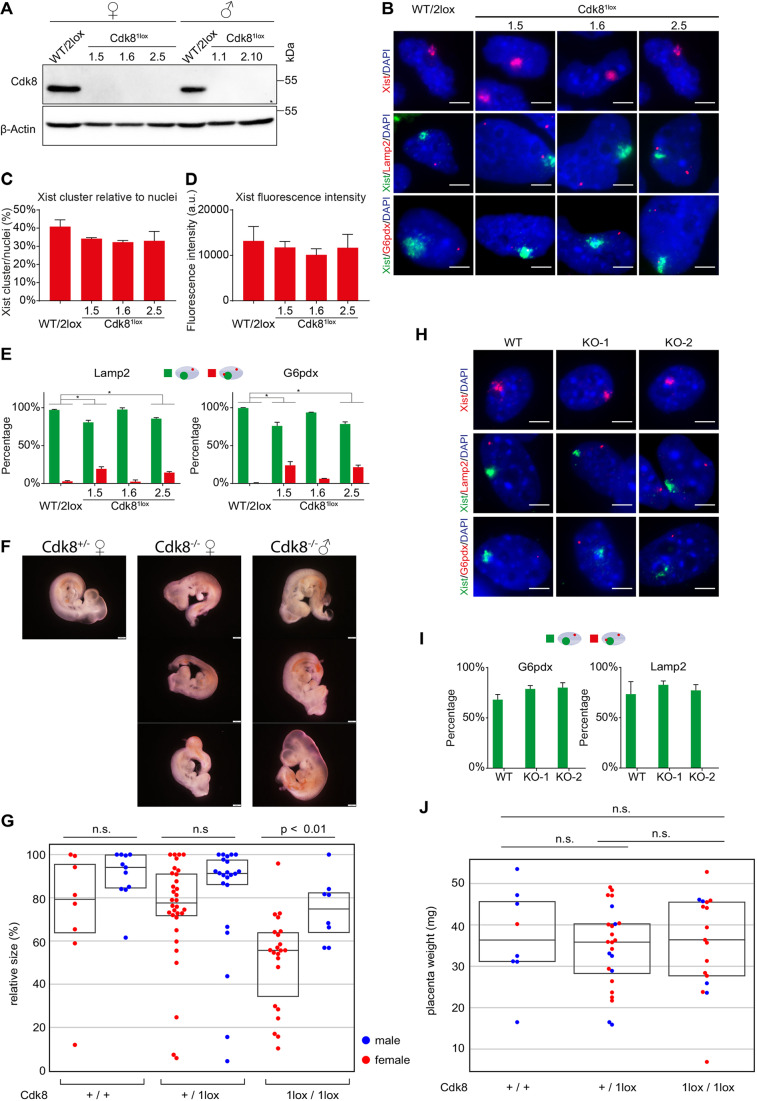
Fig. 4.
Cdk8 contributes to the initiation of XCI in female mouse development. (A) Western blot analysis of Cdk8 with β-Actin as loading control in ESCs established from embryos of crosses between Cdk8WT/1lox Sox2-Cre+/− males and Cdk82lox/2lox females. (B) RNA FISH expression analysis of Xist and X-linked genes Lamp2 (middle row) or G6pdx (bottom row) in homozygous female Cdk81lox and control female ESCs after 96 h RA differentiation. Top row, Xist (red); middle and bottom rows, Xist (green) and X-linked genes (red), Lamp2 (middle) and G6pdx (bottom) RNA FISH. DNA was stained with DAPI (blue). (C) Quantification of Xist RNA FISH analysis of Cdk81lox and control (WT/2LOX) female ESCs after 96 h RA differentiation. The percentage of Xist clusters is shown relative to counted nuclei (>100 counted). The experiments were performed in triplicate. Data are mean±s.d. a.u., arbitrary units. (D) Quantification of the fluorescence intensity of Xist clusters from RNA FISH (>100 clusters measured). The experiments were performed in triplicate. Data are mean±s.d. (E) Double FISH quantification of biallelic expression of the X-linked genes Lamp2 and G6pdx, and overlap with an Xist cluster. Percentage (>100 Xist clusters analysed) of Xist clusters without detectable biallelic X-linked gene expression (green bars), and Xist clusters with overlapping X-linked gene expression (red bars) are shown. The experiment was performed in triplicate. Data are mean±s.d. Asterisk indicates a significant difference from the wild-type control (P<0.05). (F) Representative images of heterozygous control female (left), and homozygous female (middle) and male Cdk8 mutant (right) embryos from one litter at E10.5. (G) Statistical analysis of embryo size as determined by image segmentation. The swarm plot shows the size normalized to largest size of the litter for each embryo with a box plot showing the mean and quartiles superimposed (n.s., not significant). (H,I) Female primary mouse embryonic fibroblasts derived from E10.5 Cdk81lox/1lox embryos. (H) RNA FISH expression analysis of Xist and X-linked genes Lamp2 (middle) or G6pdx (bottom). Top, Xist RNA FISH (red); middle and bottom, Xist (green); and X-linked genes (red) RNA FISH. DNA was stained using DAPI (blue). (I) Quantification of RNA FISH analysis of biallelic X-linked gene expression in the presence of Xist clusters (as in B). The percentage of nuclei showing monoallelic expression of the X-linked genes G6pdx and Lamp2 (green bars) in nuclei with Xist clusters are shown (>100 Xist clusters containing cells analysed). No cells with biallelic Xist expression were observed. The experiments were performed in triplicate. Data are mean±s.d. (J) Statistical analysis of placenta weights. Swarm plot showing the weight of individual placentae in mg for each genotype. Sex is indicated by the same colours as in G (n.s., not significant). Numbers above the lanes and panels in A and B, respectively, and on the x-axes in C, D and E indicate the clone numbers of independent ESC lines. Scale bars: 5 μm (B,H); 500 μm (F).

