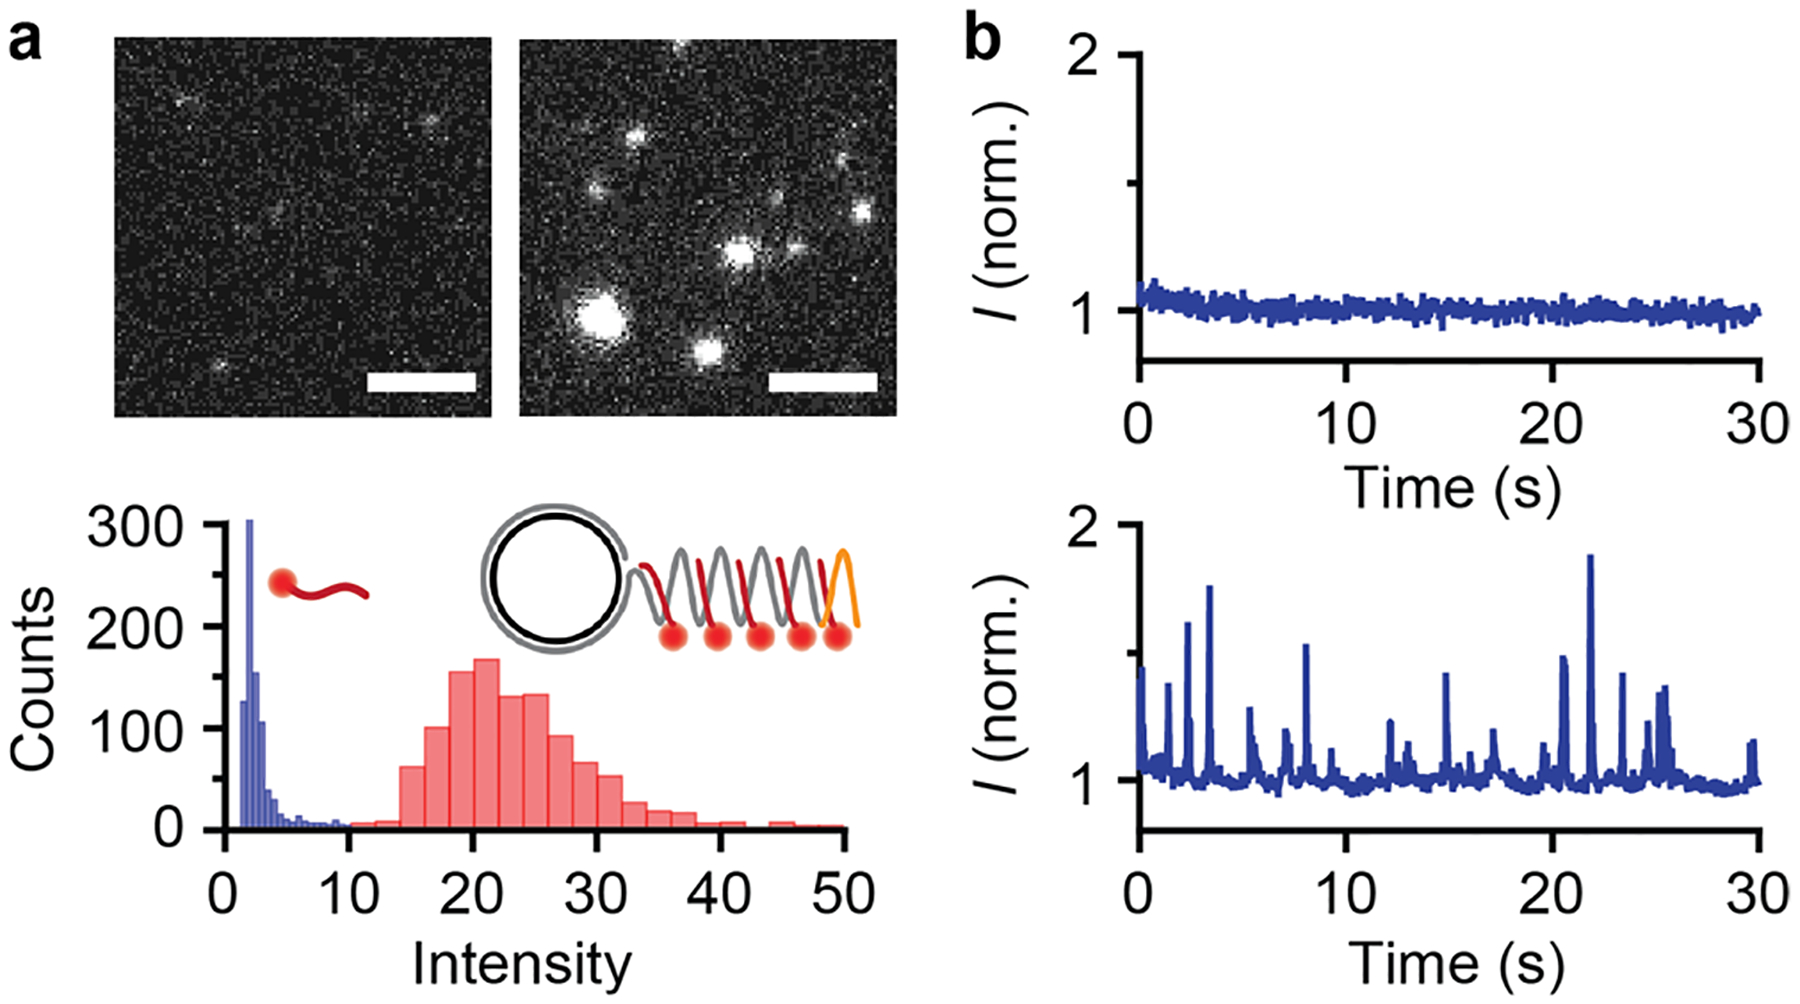
Figure 2.

Characterization of extended and fluorescently labeled microRNA at the single molecule level. (a) Fluorescence micrographs of Cy3-conjugated dye-DNA probes (left) and miR-375 amplicons labeled with the same dye-DNA probes (right). Scale bars represent 5 μm. Intensity histograms are shown below for probes alone (blue) and labeled microRNA products (red). (b) Temporal fluorescence intensity in a diffraction limited confocal spot for dye-DNA probes in solution (top) and labeled microRNA products (bottom).
