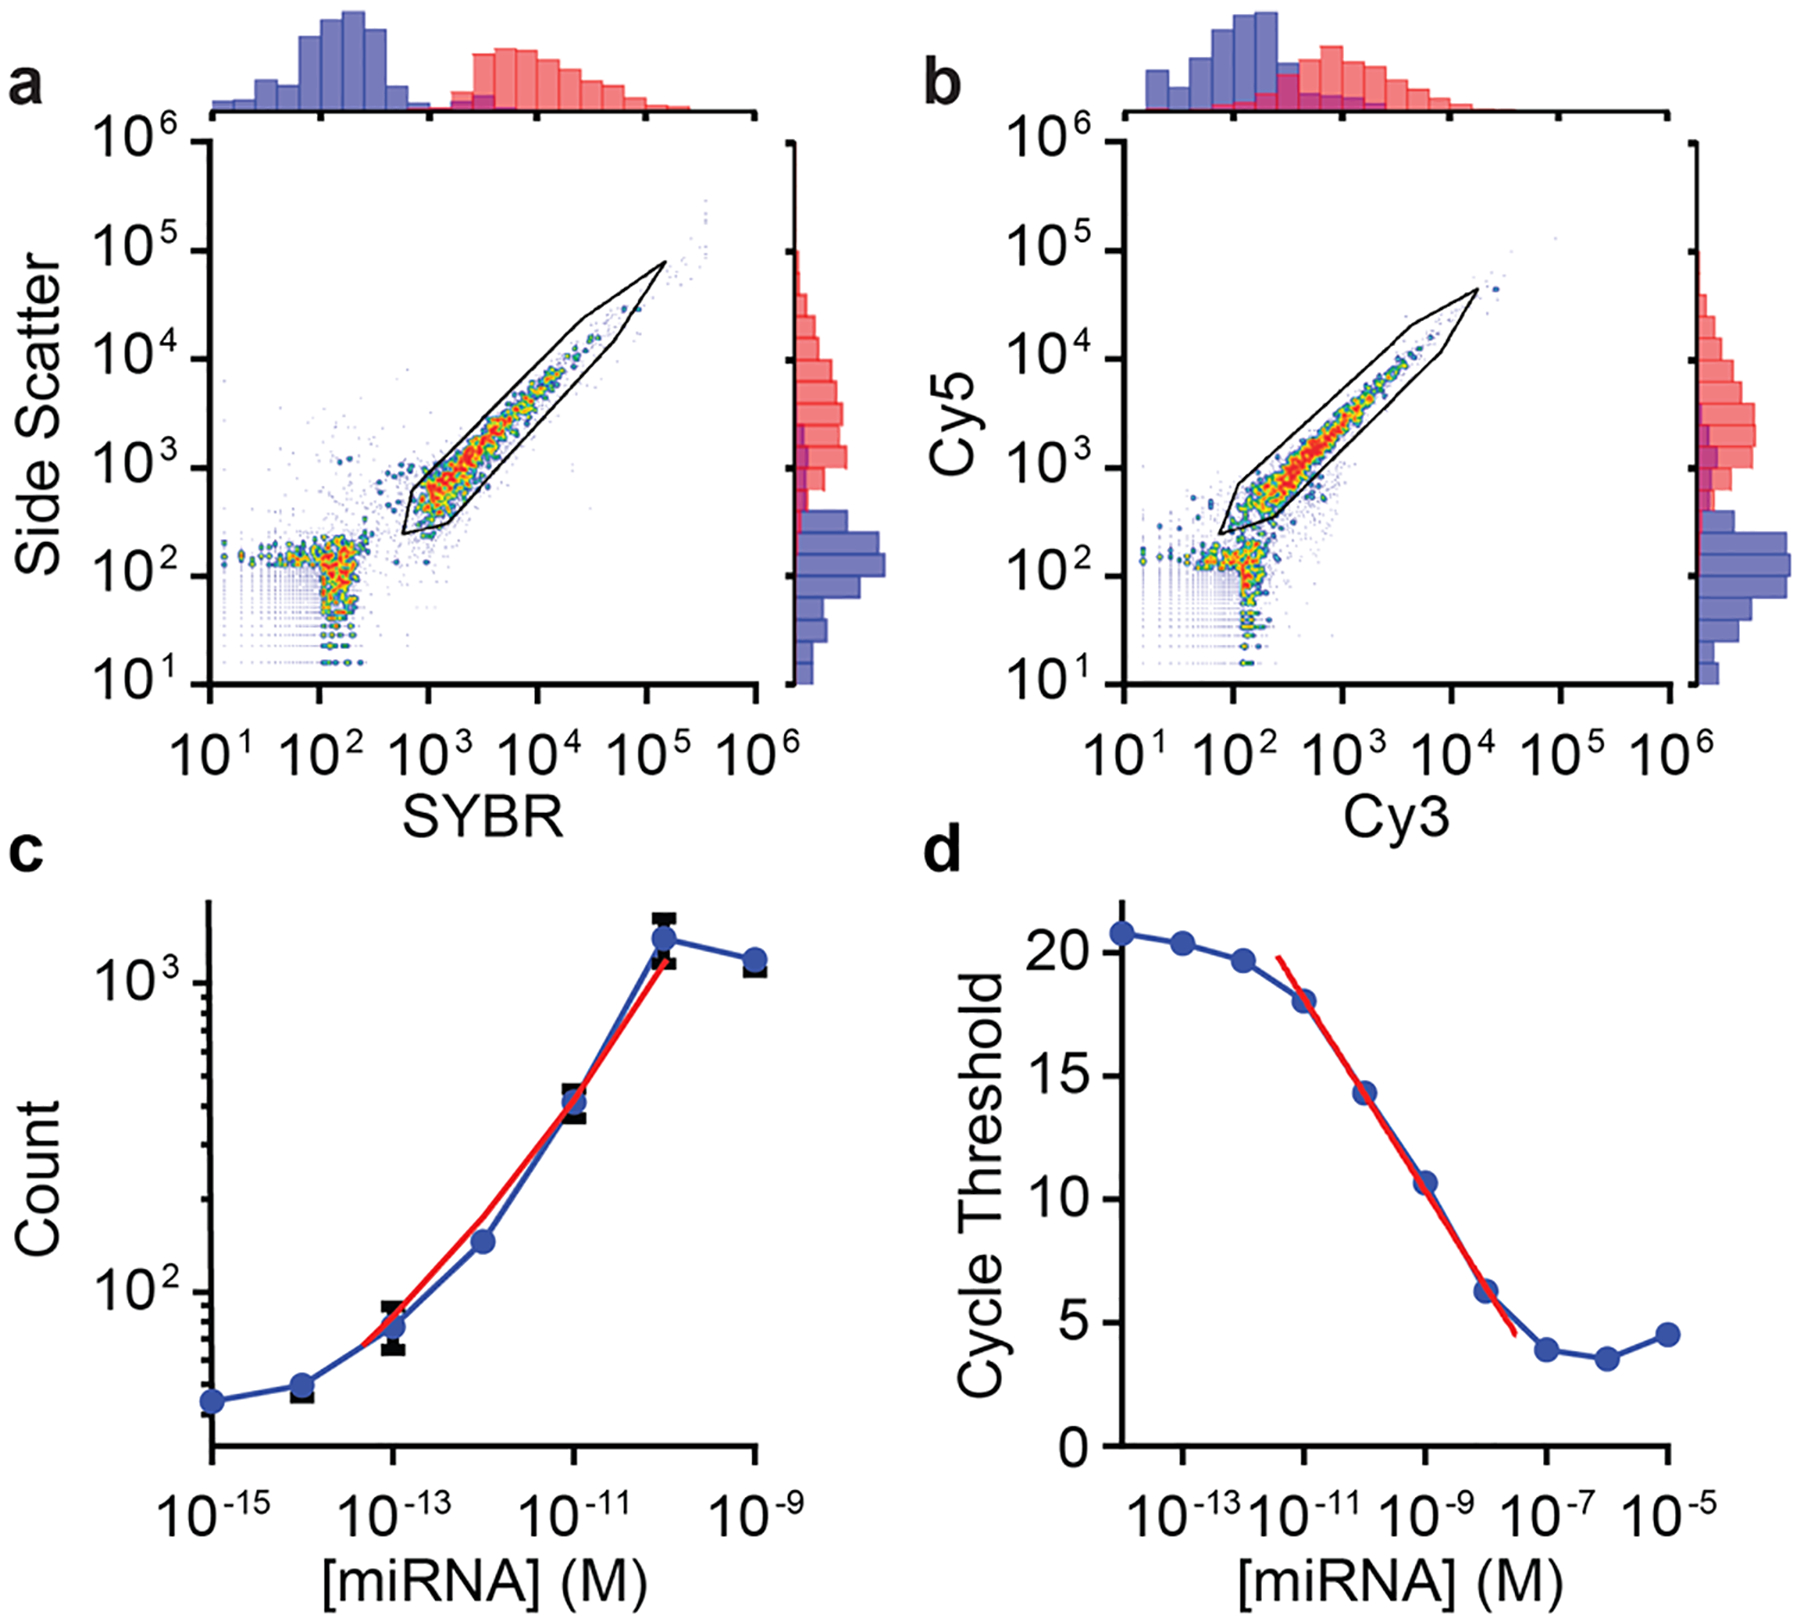
Figure 3.

Detection of fluorescently labeled and extended microRNA in a flow cytometer. (a,b) Scatter plots show events detected for microRNA amplicons labeled with both dye-DNA probes and SYBR Green. (a) Correlation between side scattering and SYBR Green fluorescence intensity. Black lines indicate gates. (b) Same measurement as (a) showing Cy5 and Cy3 intensity channels for each event. (c) Correlation between molecular counts and microRNA concentration with all other conditions held constant. Red line indicates the linear dynamic range. (d) microRNA quantification through reverse transcription polymerase chain reaction. Plot shows the measured cycle threshold for each microRNA concentration using TaqMan qRT-PCR reagents and a real-time PCR instrument. All data points and error bars represent the mean and standard deviation, respectively, of three technical replicates.
