Figure 4.

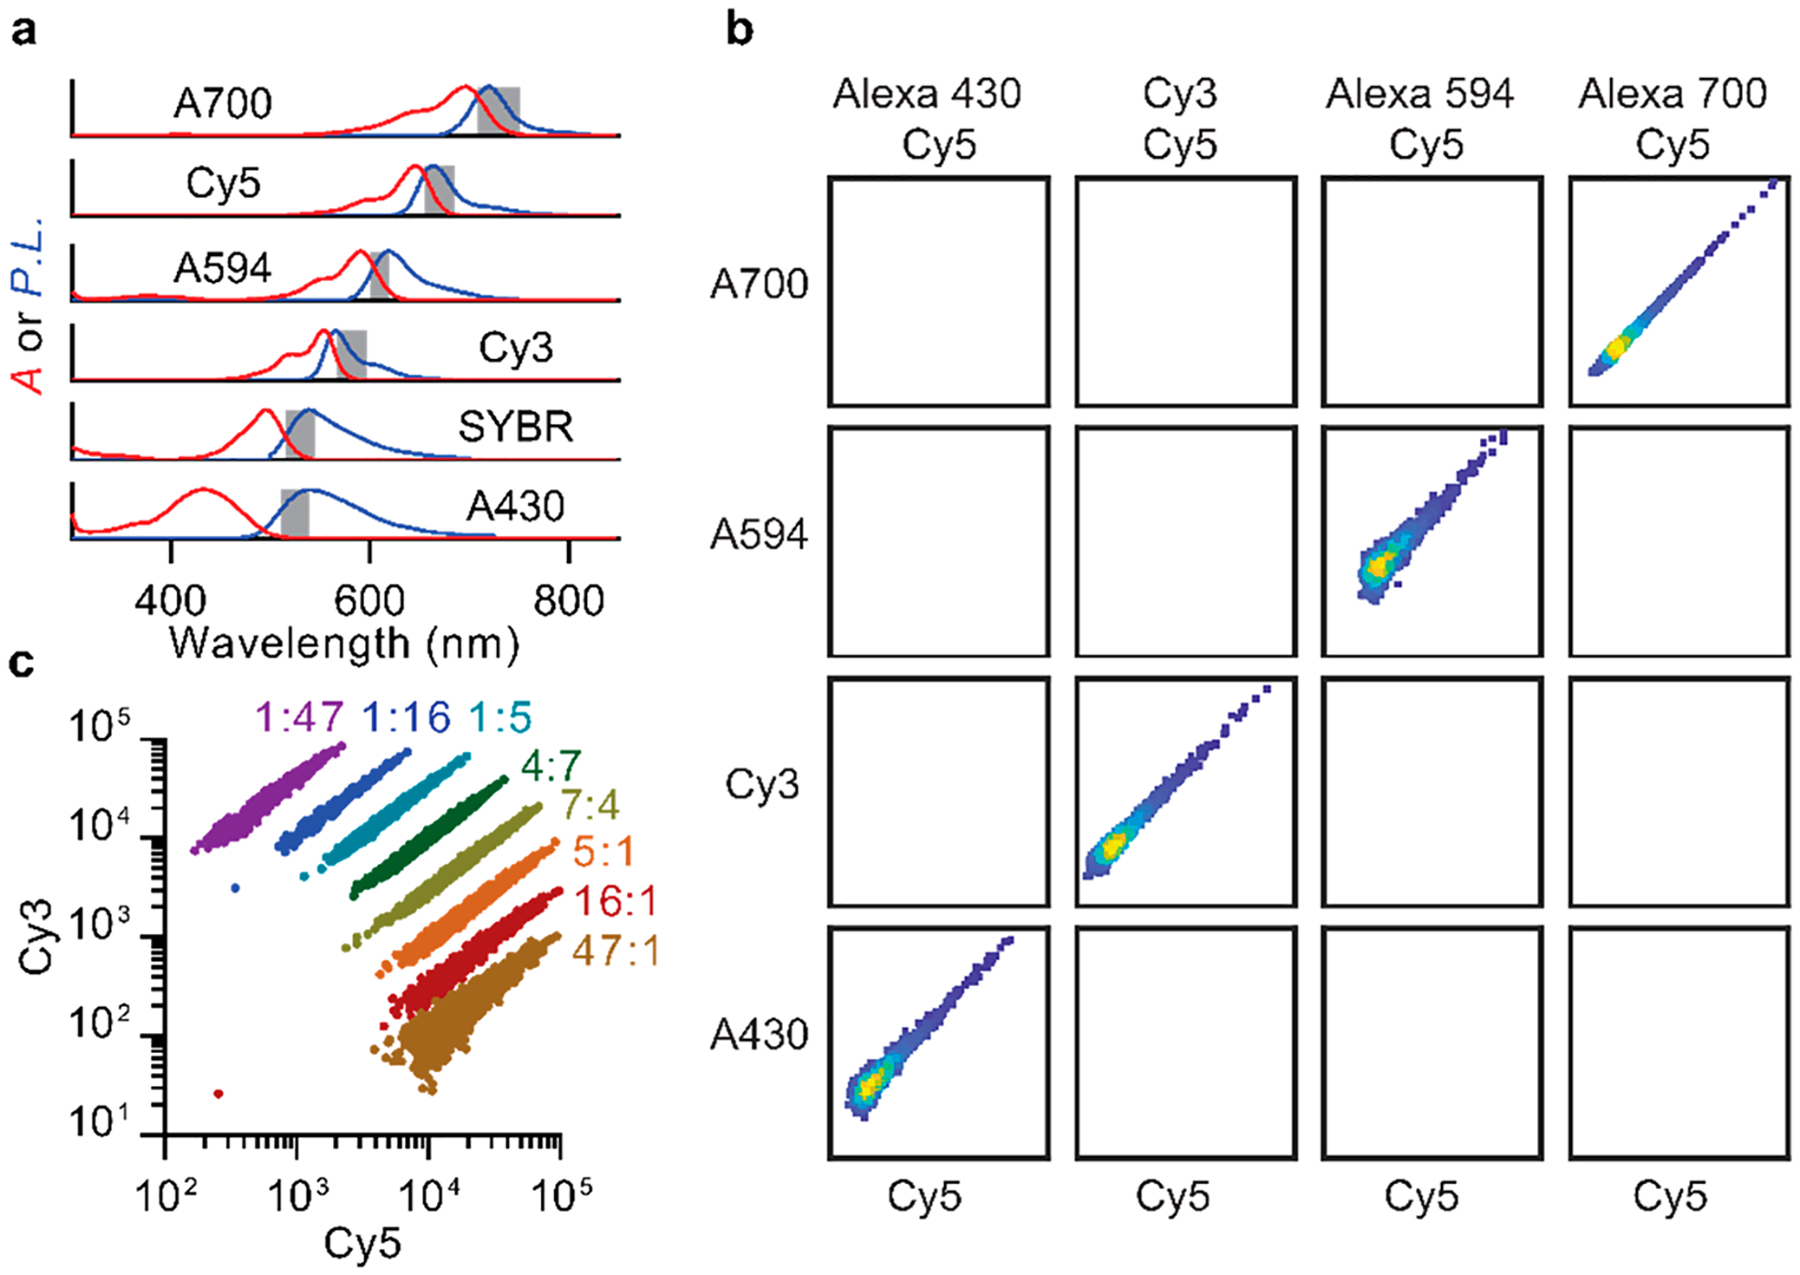
Multispectral labeling of extended microRNA through hybridization with multicolor dye-DNA. (a) Fluorophore absorption (A, red) and photoluminescence (P.L., blue) spectra for tested dyes are shown with normalized intensities. Gray highlight indicates emission bandpass filters. (b) Representative data for event counts in biparametric color channels using the dye combinations indicated at top. Axes show logarithmically scaled fluorescence intensity for indicated fluorophores. (c) Ratiometric labeling of miR amplicons with Cy3/Cy5 dye pairs shows discrete bands with narrow intensity profiles. Data were collected for 10 pM microRNA concentrations and >79 000 counts.
