Figure 5.

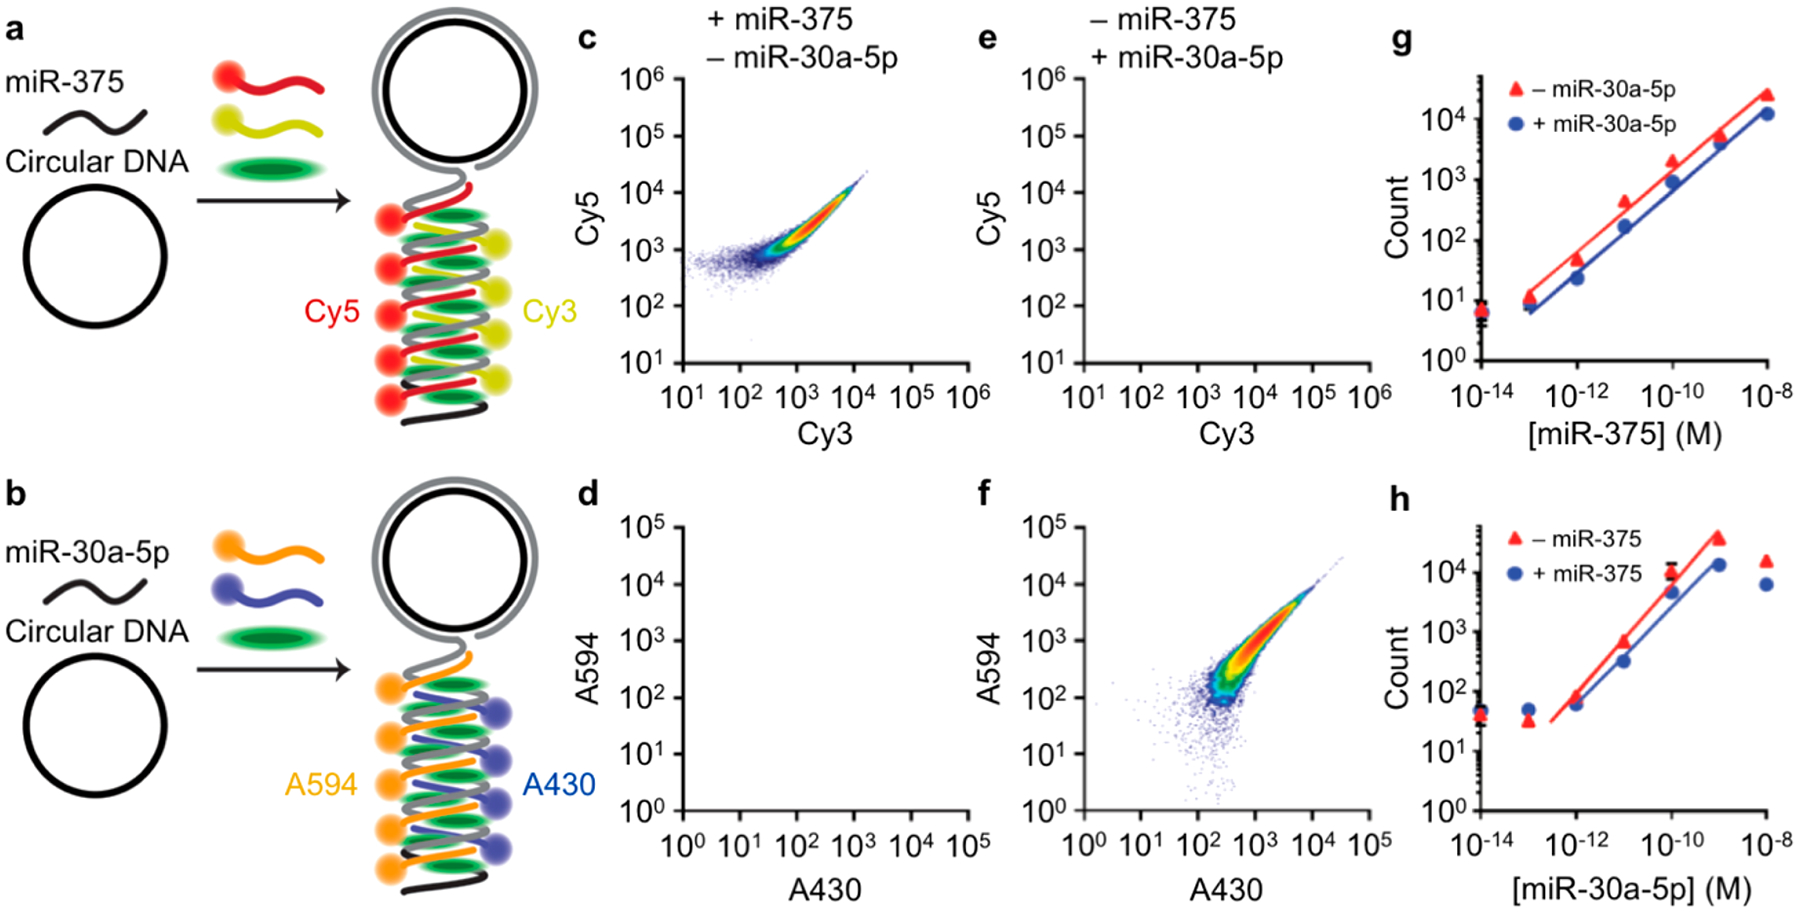
Multiplexed detection and quantification of microRNA in a flow cytometer. (a,b) Schematic diagrams depict fluorescent labeling and detection of (a) miR-375 using Cy3-DNA and Cy5-DNA probes or (b) miR-30a-5p using A430-DNA and A594-DNA probes with each amplicon labeled with SYBR Green. All templates and hybridization probes are mixed together to perform the multiplexed assay. The schematics illustrate molecular mechanisms but are not drawn to scale. (c,e) Scatter plots show events detected in the miR-375-specific Cy3/Cy5 biparametric color channel or the (d,f) Alexa-430/Alexa-594 color channel for amplicons generated through RCA reactions containing (c,d) 10 pM miR-375 alone or (e,f) 10 pM miR-30a-5p alone. Events were filtered by SYBR Green and side-scatter prior to gating in dye-DNA channels. (g) Correlation between Cy3/Cy5 counts and miR-375 concentration in the presence and absence of 10 pM miR-30a-5p. Trend lines represent the linear dynamic range. (h) Correlation between Alexa-430/Alexa-594 counts and miR-30a-5p concentration in the presence and absence of 10 pM miR-375. Trend lines represent the linear dynamic range.
