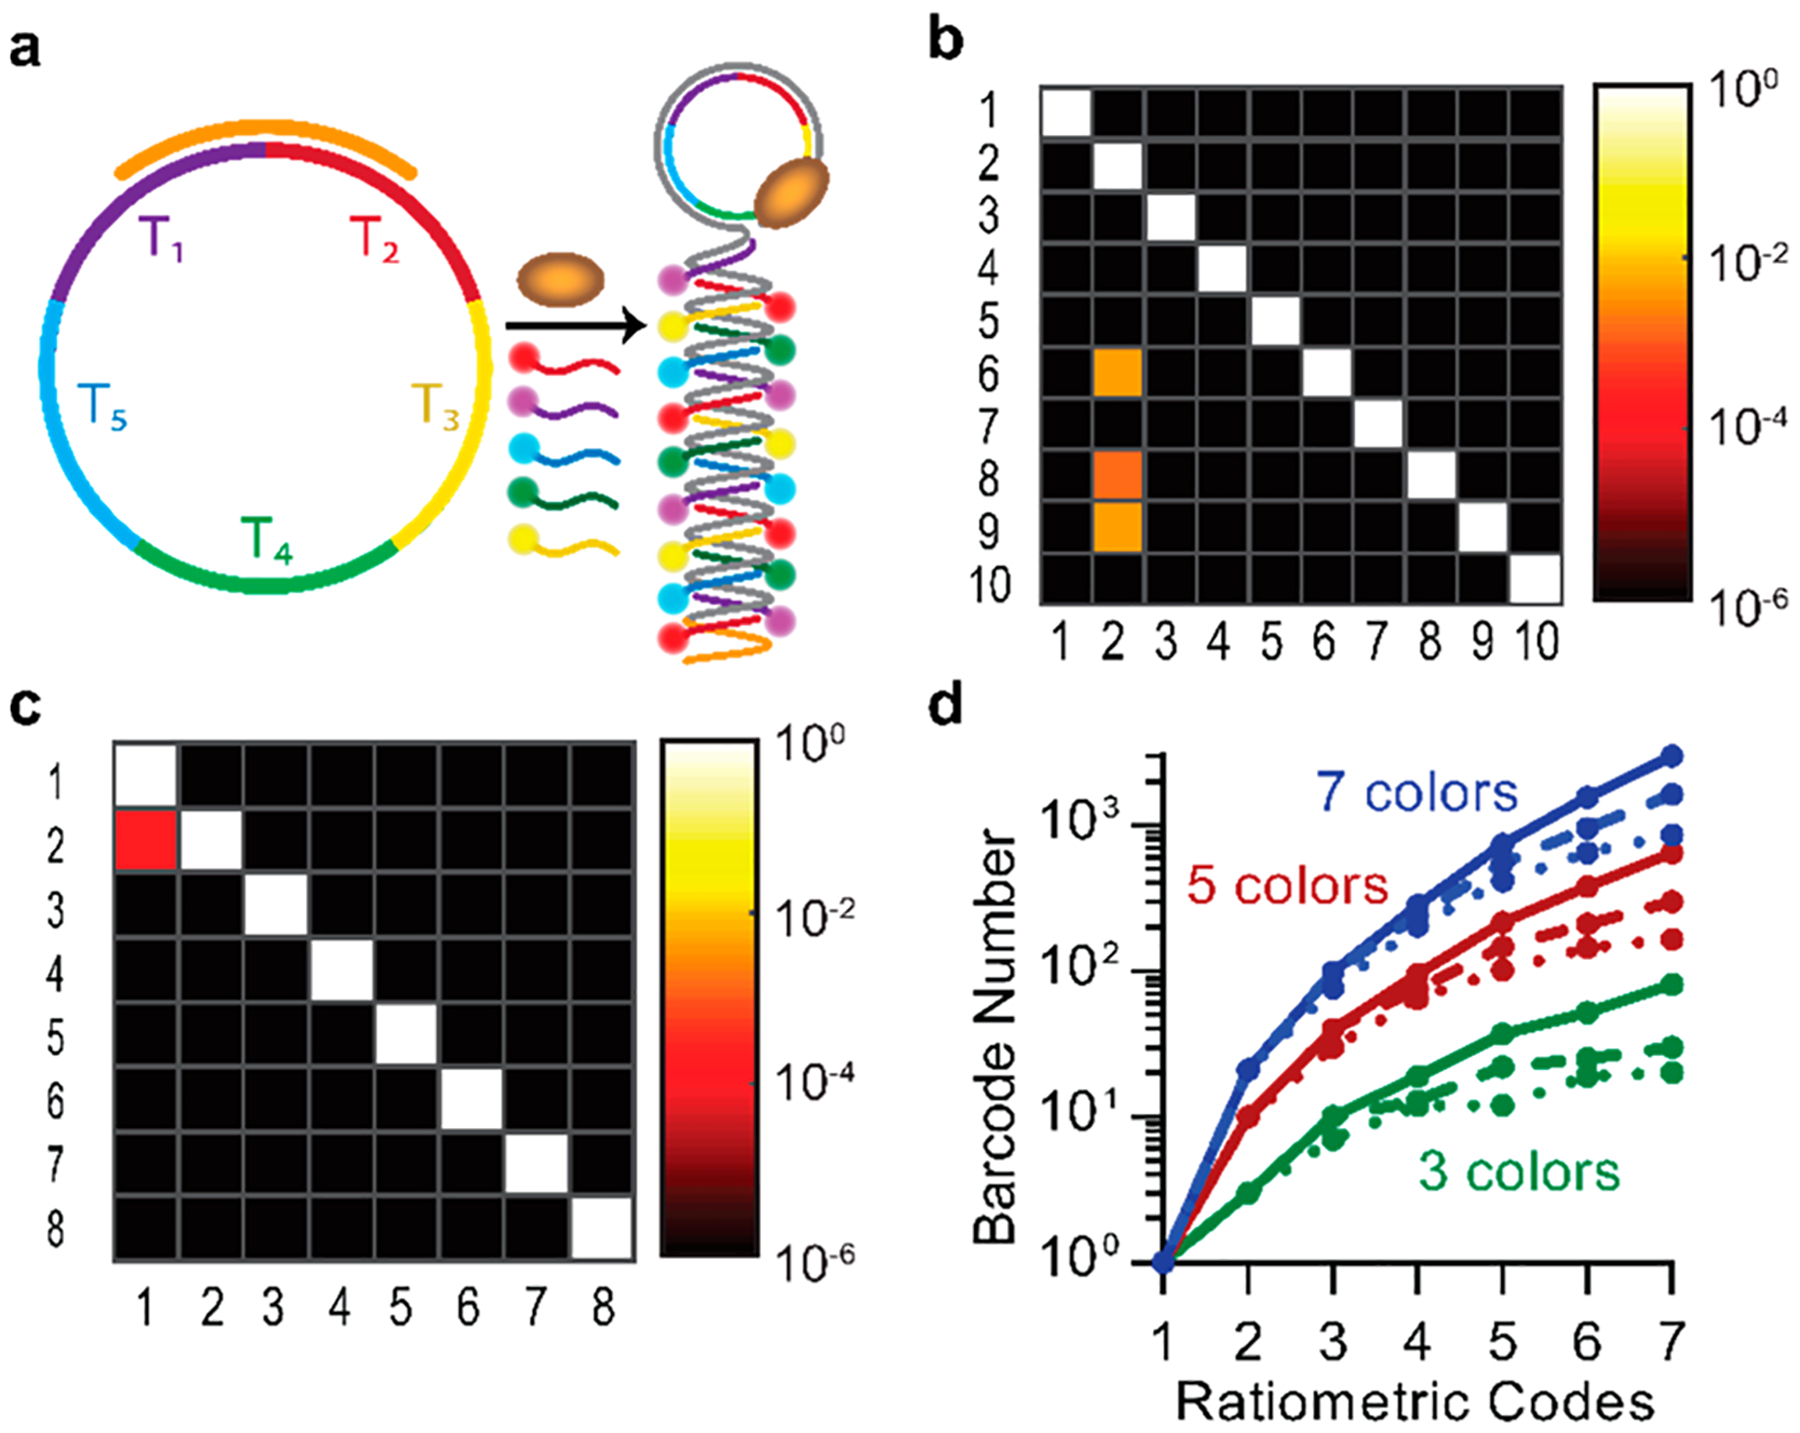
Figure 6.

Optical differentiation and barcoding of microRNAs. (a) Schematic depiction of multicolor labeling based on sequence-specific dye-DNA hybridization. (b) Heat map shows false positive count rates for the biparametric color channels from Figure 4b. Fluorophore pairs are plotted on the y-axis, and optical channels are plotted on the x-axis. Channels and fluorophores corresponding to numerical labels are provided in SI Table S2. (c) Heat map of empirical false positive count rates between ratiometric channels from Figure 4c. Fluorophore pairs are plotted on the y-axis, and optical channels are plotted on the x-axis. Channels and fluorophores corresponding to numerical labels are provided in SI Table S3. (d) Calculated optical barcode number for indicated color code number and ratiometric code number. Colors indicate three (green), five (red), or seven (blue), color combinations. Solid curves show the total code numbers, whereas dashed and dotted lines indicate code numbers with maximum false positive count rates of 10−3 and 10−6, respectively.
