
Figure 3. Macrophages exhibit chemokine mediated migration towards tumors in vitro and in vivo.
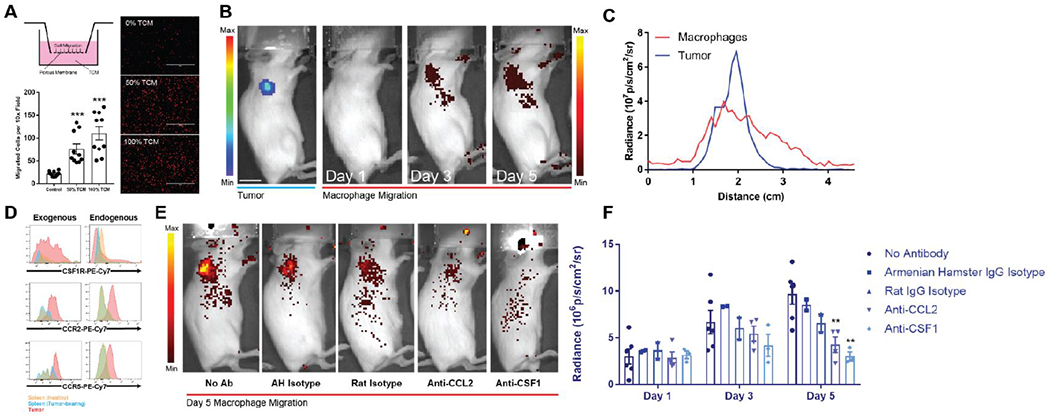
(A) Transwell assays performed with tumor conditioned media as the chemoattractant revealed a concentration dependent increase in RAW264.7 macrophage migration by optical microscopy (right) with quantification of migrated cells per 10× field revealing greater than four-fold increases in migration (bottom). Macrophages are shown in red false-color. Scale bars measure 400 μm. (B) VivoTrack 680 labeled macrophages demonstrate a time-dependent accumulation in a subcutaneous Fluc-expressing tumor from days 1 to 5 after intravenous injection as visualized with in vivo fluorescence microscopy. Scale bar measures 1 cm. Left and right radiance scales apply to the tumor and macrophage signals respectively. (C) Tumor and macrophage signal strongly co-localize on radiance line traces as a function of distance from scruff across the right shoulder. (D) Flow cytometry of tumor-resident macrophages (endogenous) and adoptively transferred tumor-infiltrating macrophages (exogenous) shows increased expression of CSF1R, CCR2, and CCR5 compared to splenic macrophages in both healthy and tumor bearing mice. (E-F) Neutralizing doses of anti-CCL2 (n = 4, p = 0.0077) and anti-CSF1 (n = 3, p = 0.0049) antibody interferes with macrophage migration to subcutaneous tumors more so than their respective isotype control antibodies. Radiance values are background subtracted. * indicates statistical significance at p < 0.05, ** indicates statistical significance at p < 0.01, and *** indicates statistical significance at p < 0.001. Error bars depict s.e.m. TCM, tumor conditioned media; Ab, antibody; AH, Armenian hamster.