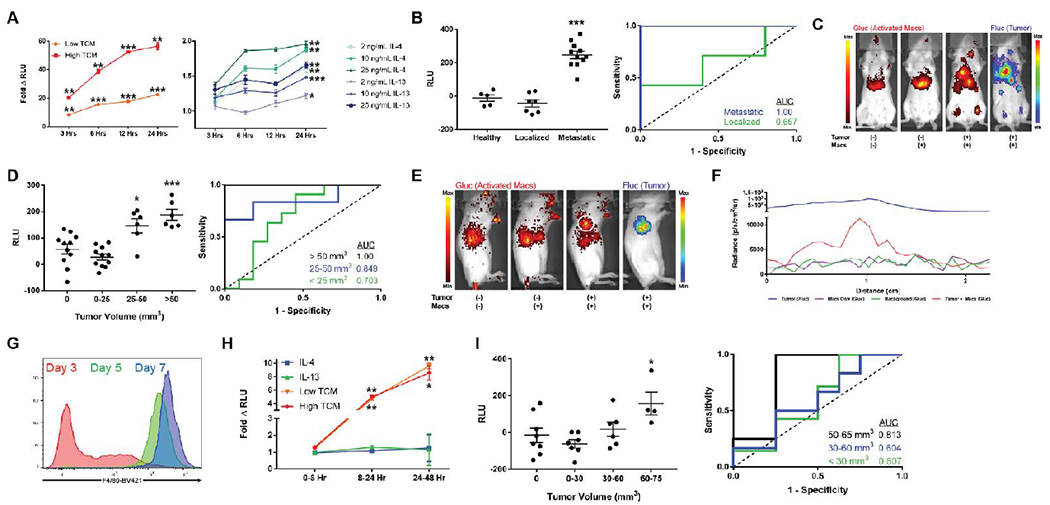
Figure 4. Macrophage sensors enable detection and visualization of small tumors in vivo.

(A) RAW264.7 macrophages engineered to express the pARGI-Gluc reporter exhibit a time and concentration dependent secretion of Gluc when stimulated with tumor conditioned media (left) and IL-4/IL-13 (right) as assayed from culture media. Statistical significance in the right plot only shown for the 24 hour time point. Fold change is calculated relative to non-activated macrophage sensor. (B) RLU values assayed from plasma of 4T1 tumor bearing mice injected with sensor showed no elevations above healthy controls (n = 7, AUC = 0.657, 95% CI 0.335-0.979, p = 0.372) in localized lung microtumors but significant elevations in disseminated disease (n = 11, AUC = 1.00, p = 0.0018). RLU values are background subtracted to eliminate non-specific signal from healthy plasma. (C) BLI of activated macrophages and tumor dissemination reveals marked co-localization of macrophage sensor activation with sites of disease. (D) In a localized subcutaneous CT26 model, background subtracted plasma Gluc from activated macrophage sensor could reliably detect > 50 mm3 tumors with an AUC = 1.00 (n = 6, p = 0.0009) and 25-50 mm3 tumors with an AUC = 0.849 (n = 6, 95% CI 0.620-1.00, p = 0.021). (E) BLI and (F) right shoulder radiance line traces show visible spatial overlap of activated macrophages (white circle) with right shoulder tumors. (G) Bone marrow derived cells cultured in M-CSF exhibit increasing levels of monocyte/macrophage maturity marker F4/80 with a monocyte phenotype present at day 5 of culture. (H) BMDMs electroporated with the pARG1-Gluc reporter exhibit time dependent secretion of Gluc with tumor conditioned media as assayed from culture media. (I) Background subtracted plasma Gluc from activated BMDM sensors shows significant elevation (n = 4, p = 0.0342) when localized subcutaneous CT26 tumors reach volumes of 60-75 mm3 (AUC = 0.813, 95% CI 0.555-1.00, p = 0.0894). Scale bars measure 1 cm. Left and right radiance scales in (C) and (E) apply to the activated macrophages and tumor signals respectively. * indicates statistical significance at p < 0.05, ** indicates statistical significance at p < 0.01, and *** indicates statistical significance at p < 0.001. Error bars depict s.e.m. TCM, tumor conditioned media; RLU, relative luminescence units; AUC, area under the curve.
