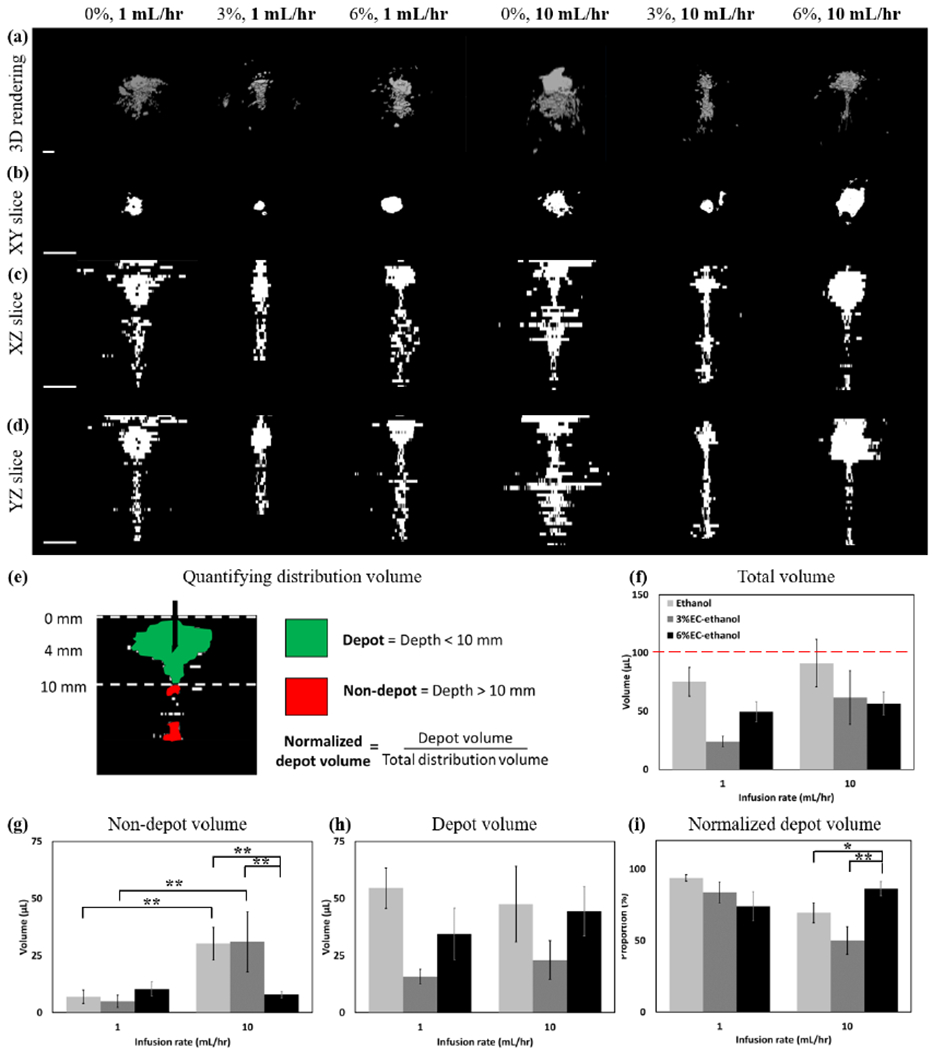
Fig. 3.

Representative images of 0%, 3%, and 6% EC dissolved in ethanol injected at both 1 and 10 mL/hr are shown in each column. A needle insertion rate of 2 mm/s and programmed needle depth of 5.2 mm were used for all experiments. (a) 3D representations of the distribution volume. (b) XY, (c) XZ, and (d) YZ slices taken through the center of the injection cloud. All scale bars are 5 mm. Each z-slice was adjusted to keep the segmented region in the center of the image. (e) To assess the amount of fluid localized the needle tip, fluid was segmented into the depot volume, which was defined as the largest region around the needle tip in the top 10 mm of the tissue, and non-depot volume, which was defined as the fluid below 10 mm into the tissue. Depot and non-depot are colored in green and red, respectively. (f) The total injected fluid distribution volume was quantified for infusions of 0, 3 and 6% EC dissolved in ethanol injected at a rate of either 1 or 10 mL/hr. The nominal infusion volume for all injections was 100 μL and is represented by the red dotted line. The total distribution volume was highest for pure ethanol (p<0.05) and a rate of 10 mL/hr (N.S.). (g) The non-depot volume was highest for pure ethanol and 3% EC-ethanol. 6% EC-ethanol was the only formulation in which non-depot volume did not depend on infusion rate. (h) The depot volume for each rate and EC concentration was quantified (i) The normalized depot volume (depot volume / total distribution volume) quantified the concentration of fluid within the depot. 6% EC-ethanol infused at 10 mL/hr had the largest proportion of injected fluid within the depot. All error bars depict standard error and all groups had a sample size of n = 5. * = p<0.1, ** = p<0.05.
