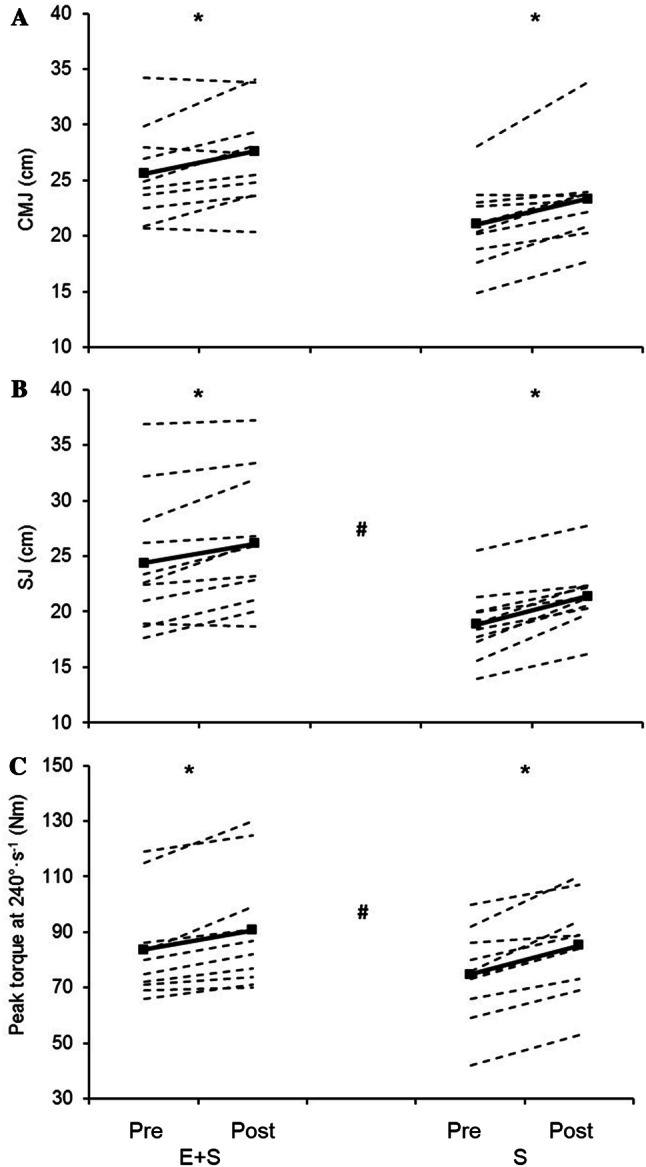
Fig. 3.

Individual values (dotted lines) and mean values (solid lines) before (Pre) and after (Post) the intervention period for athletes adding strength training to their normal endurance training (E + S), and previously untrained individuals performing strength training only (S). a Counter movement jump (CMJ). b Squat jump (SJ). c Peak torque in isokinetic knee extension at an angular velocity of 240°·s−1. *Larger than pre (p < 0.05), # the percent change from pre is different between E + S and E (p < 0.05)
