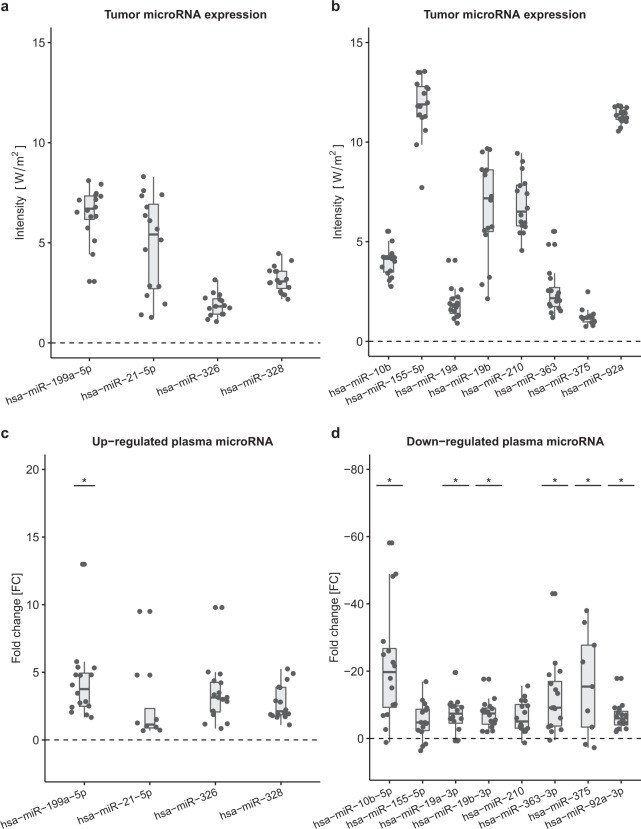
Figure 2.
Screening cohort tumor microRNA expression a) and b). Expression levels in tumor of relevant microRNAs are plotted as intensity (median, 25% and 75% percentiles). Array data were normalized using robust multi-array average. Up-regulated c) and Down-regulated d) plasma microRNAs plotted as fold change (2−ΔΔCt) difference between cases and controls (median, 25% and 75% percentiles). RT-PCR data were normalized using miR-23a. Statistically significant difference (<0.0003) between cases and controls adjusted for age and sex in quantile regressions is marked with a *.

