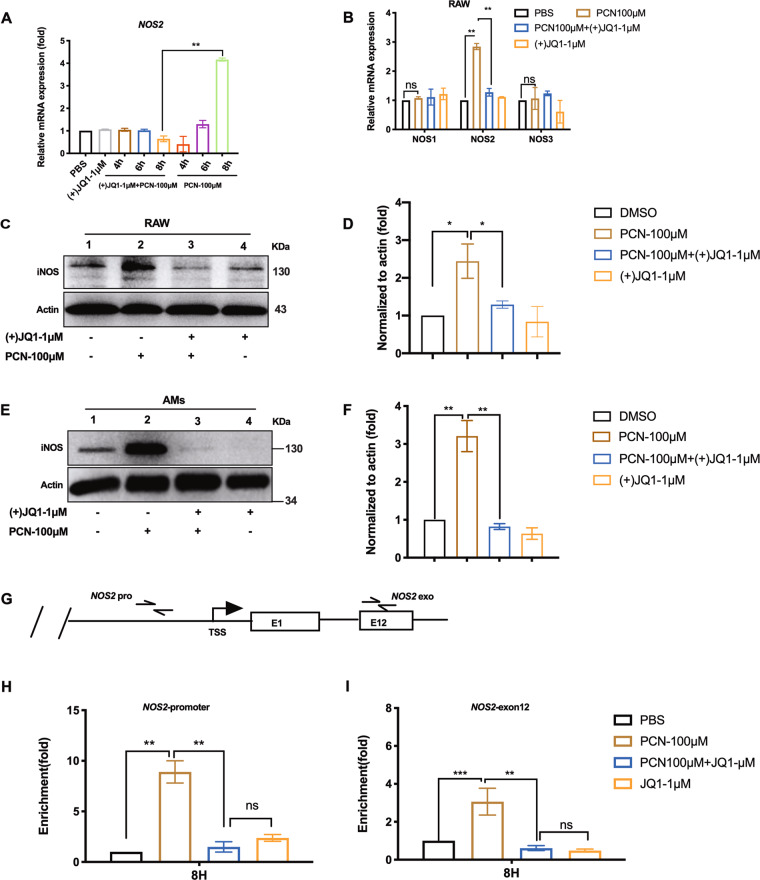
Fig. 5. (+)JQ1 restrained iNOS expression and recruitment of Brd4 to NOS2 locus.
a RT-qPCR showing the mRNA levels of NOS2 in RAW cells at indicated time points post-PCN challenge. b mRNA levels of NOS1/2/3 in RAW cells at 8 h post-PCN challenge. iNOS expression in RAW cells (c) or AMs (e) at 8 h post-PCN challenge. d, f Densitometry analysis of iNOS expression in c, e. g Illustration of ChIP-qPCR amplicons at NOS2 locus in RAW cells under the same condition as b (label “pro” as promoter region and label “exo” as the 12th exon region (E12); TSS: Transcription Star Site) using anti-Brd4 antibody. h qPCR showing the enrichment of Brd4 at NOS2 promoter and i the 12th exonic regions as illustrated in g. (Data shown were the mean ± SD from three independent experiments. *P < 0.05, **P < 0.01, compared with indicated group, ns, non-significant. One-way ANOVA test followed by t-test).

