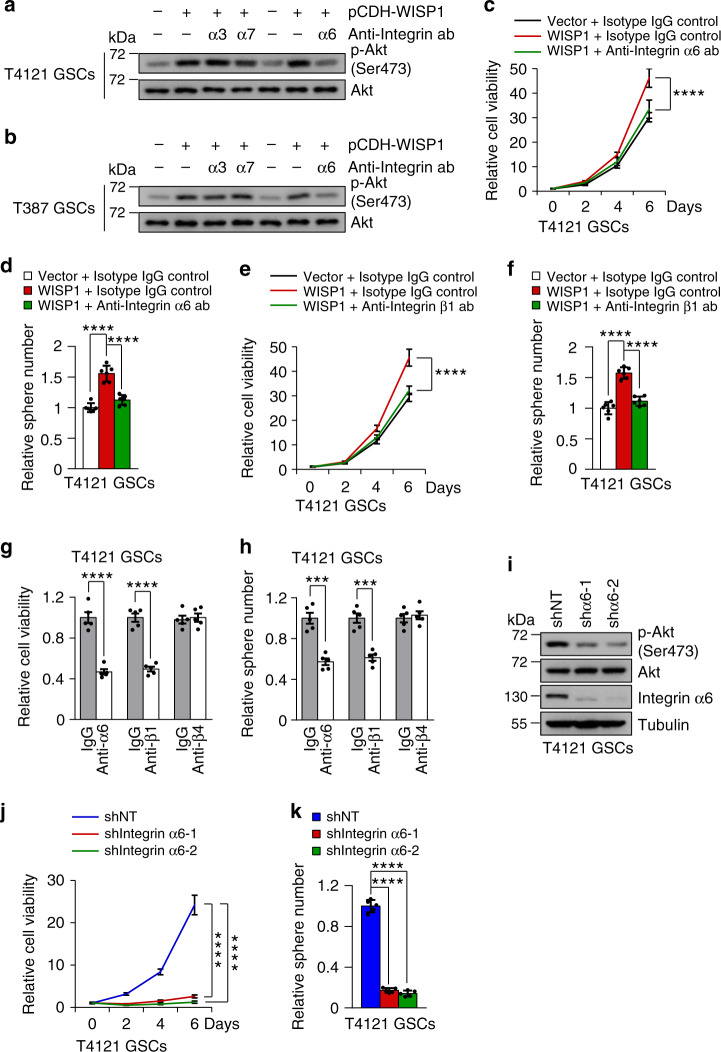
Fig. 5. WISP1 acts through Integrin α6β1 to activate Akt in GSCs.
a, b, Immunoblot analysis of Akt activating phosphorylation (Ser473) in T4121 GSCs (a) and T387 GSCs (b) treated with 5 μg/ml Integrin blocking antibody (Anti-Integrin ab) or relative isotype IgG control in combination with WISP1 overexpression or vector control for 48 h. α3, Integrin α3; α6, Integrin α6; α7, Integrin α7. c, d, Cell viability (c) or tumorsphere formation (d) assay of T4121 GSCs treated with 5 μg/ml Integrin α6 blocking antibody (ab) or isotype IgG in combination with WISP1 overexpression or vector control. n = 6 biological independent samples. Data are shown as means ± s.d. ****p <0.0001, two way ANOVA analysis followed by Tukey’s multiple test (c). ****p <0.0001, two-tailed unpaired t-test (d). e, f, Cell viability (e) or tumorsphere formation (f) assay of T4121 GSCs treated with Integrin β1 blocking antibody (5 μg/ml) or isotype IgG in combination with WISP1 overexpression or vector control. n = 5 (e) or 6 (f) biological independent samples. Data are represented as mean ± s.d. ****p <0.0001, two way ANOVA analysis followed by Tukey’s multiple test (e). ****p <0.0001, two-tailed unpaired t-test (f). g, h, Cell viability (g) or tumorsphere formation (h) assay of T4121 GSCs treated with Integrin blocking antibody (5 μg/ml) or isotype IgG for 6 days. n = 5 biological independent samples. Data are represented as mean ± s.d. ***p = 0.001, ****p <0.0001, two-tailed unpaired t-test. α6, Integrin α6; β1, Integrin β1; β4, Integrin β4. i Immunoblot analysis of Akt phosphorylation (Ser473) and Integrin α6 expression in T4121 GSCs transduced with shIntegrin α6 or shNT control. j, k, Cell viability (j) or tumorsphere formation (k) assay of T4121 GSCs transduced with shIntegrin α6 or shNT. n = 5 biological independent samples. Data are shown as means ± s.d. ****p <0.0001, two way ANOVA analysis followed by Tukey’s multiple test (j). ****p <0.0001, two-tailed unpaired t-test (k). Source data are provided as a Source data file.

