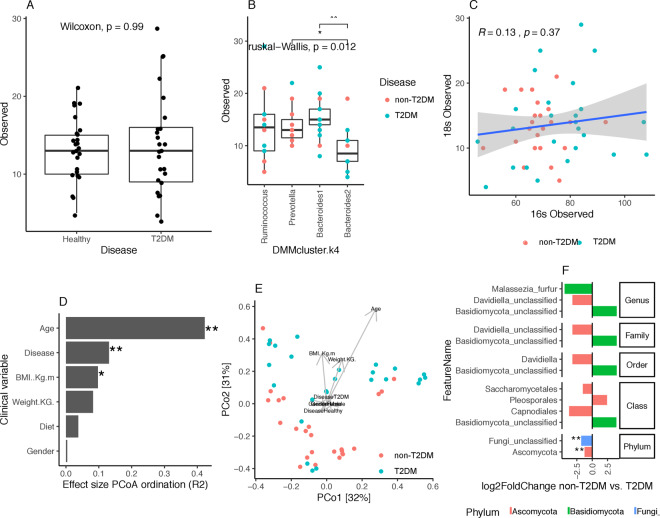
Figure 2.
Fungal profiling of gut microbiome. (A) Alpha diversity distributions (observed species) between non-T2DM and T2DM groups. (B) Fungal diversity distributions (observed species) across DMM enterotypes (** = P value < 0.001; * = P value < 0.05; Wilcoxon rank-sum test). (C) Correlation between fungal and prokaryotic diversity (observed species). R and p corresponds to Spearman Rho and p-value of Spearman correlation test. (D) Effect sizes of environmental fitting of clinical variables and disease state over Principal coordinates ordination from panel E (** = P value < 0.05; * = P value < 0.1; permutation test). (E) Principal coordinates analyses of inter-individual differences (genus-level Bray-Curtis beta-diversity) with samples colored by disease state (non-T2DM, T2DM). Arrows represents effect sizes of the significant variables identified by environmental fitting analyses of panel D. (F) Bar plot of log2 fold changes in taxonomic feature abundance between non-T2DM controls and T2DM (P value < 0.05 in GLM model with negative binomial distribution of feature abundance by disease state adjusted by age).

