Figure 3.
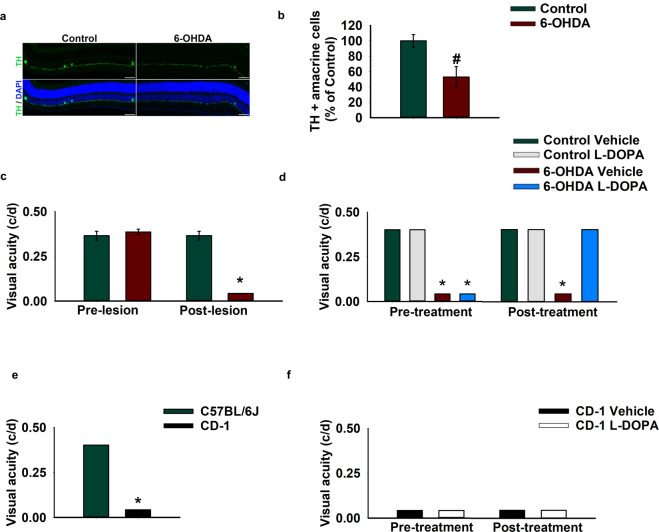
L-DOPA rescues the visual acuity impairment in 6-OHDA injected pigmented mice, but not in CD-1 albino mice. (a) Retinal sections showing TH positive (TH+) amacrine cells (green signal) in control and 6-OHDA injected mice (10X magnification, scale bar 50 µm). (b) Number of TH+ amacrine cells in control and 6-OHDA injected mice [one-way ANOVA group F(1,9)=8.687; p = 0.0163 (Control, n = 4; 6-OHDA, n = 7)]. (c) Visual acuity measured in cycles per degrees (c/d) in the pre-lesion and in the post-lesion stage. 6-OHDA caused a significant impairment in visual acuity [Pre-lesion: Mann–Whitney U = 13.5, p > 0.99, Post-lesion: Mann–Whitney U = 0, p = 0.0003 (Control n = 11; 6-OHDA n = 13)]. (d) L-DOPA rescues the visual deficit in 6-OHDA injected mice [Pre-treatment: 6-OHDA lesion Mann–Whitney U = 0, p = 0.0003, L-DOPA treatment Mann–Whitney U = 72, p > 0.99; Post-treatment: 6-OHDA lesion Mann–Whitney U = 27, p = 0.07, L-DOPA treatment Mann–Whitney U = 18, p = 0.0002 (Control vehicle n = 3; Control L-DOPA n = 3; 6-OHDA n = 9; 6-OHDA n = 9)]. Data represent mean ± SEM. # p < 0.05 vs Control; *p < 0.05 vs pre-lesion, pre-treatment stage. (e) Visual acuity measured in cycles per degrees (c/d) in CD-1 and in C57BL/6 J mice [Strain: Mann–Whitney U = 0, p = 0.0002 (C57BL/6 J, n = 10; CD-1, n = 10)]. (f) L-DOPA or Vehicle treatment in CD-1 mice [Pre-treatment: Mann–Whitney U = 12, p > 0.99; Post-treatment: Mann–Whitney U = 12, p > 0.99 (Vehicle, n = 4; L-DOPA, n = 6)]. Some histograms lack error bars because there was no variability in the performance and all animals reached performance plateau. *p < 0.05 vs C57BL/6 J.

