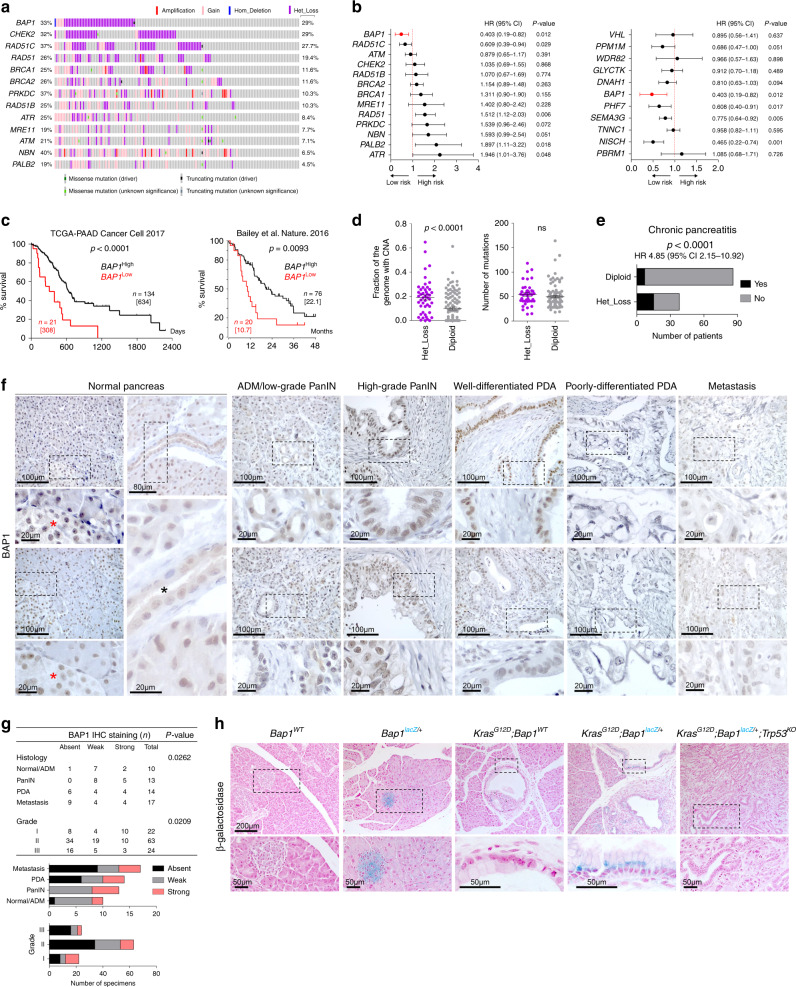
Fig. 1. BAP1 loss confers a dismal prognosis in PDA.
a Oncoprint showing the percentage of patients with copy number alterations (left) and heterozygous loss (right) for the indicated genes in the TCGA-PAAD cohort. b Forest plot showing the log hazard ratio (HR) and 95% confidence intervals (CIs) for death in the TCGA-PAAD cohort (n = 155 patients) estimated by univariate Cox regression analysis for the expression of genes involved in DNA repair (left) and located adjacent to BAP1 (right). The p-values were calculated based on the z-scores determined by Wald’s test. c Kaplan–Meier plots showing the survival of patients in the indicated studies stratified based on BAP1 expression. Median survival is shown in brackets. n, number of patients. The Log-rank (Mantel–Cox) test was used to assess statistical significance between groups. d Scatter dot plots (mean ± SEM) showing the fraction of genome carrying copy number alterations (CNA, left) and mutations (right) in TCGA-PAAD patients with heterozygous loss of BAP1. Statistical significance was determined by a two-tailed unpaired Student’s t-test. ns, nonsignificant. e Stacked bar graph showing the number of patients in the TCGA-PAAD cohort with evidence of chronic pancreatitis and heterozygous loss of BAP1. Statistical significance was determined by a two-sided Fisher’s exact test. (“Yes;HET_loss” n = 15, “NO;HET_loss” n = 23, “Yes;Diploid” n = 7, “NO;Diploid” n = 79). f Representative IHC of BAP1 in human pancreatic cancer tissue microarrays representing normal pancreas, early and advanced premalignant lesions, well- and poorly differentiated pancreatic ductal adenocarcinoma (PDA), and metastatic disease in the liver. ADM, acinar-to-ductal metaplasia; PanIN, pancreatic intraepithelial neoplasia. Red and black asterisks indicate islets and a duct, respectively. g Contingency table (top) and stacked bar graphs (bottom) showing the staining intensity of BAP1 with regard to histology and tumor grade. Statistical significance was determined by a χ2-test. h β-Galactosidase staining in pancreata of the indicated genotypes at 8–10 weeks of age. Source data are provided as a Source Data file.

