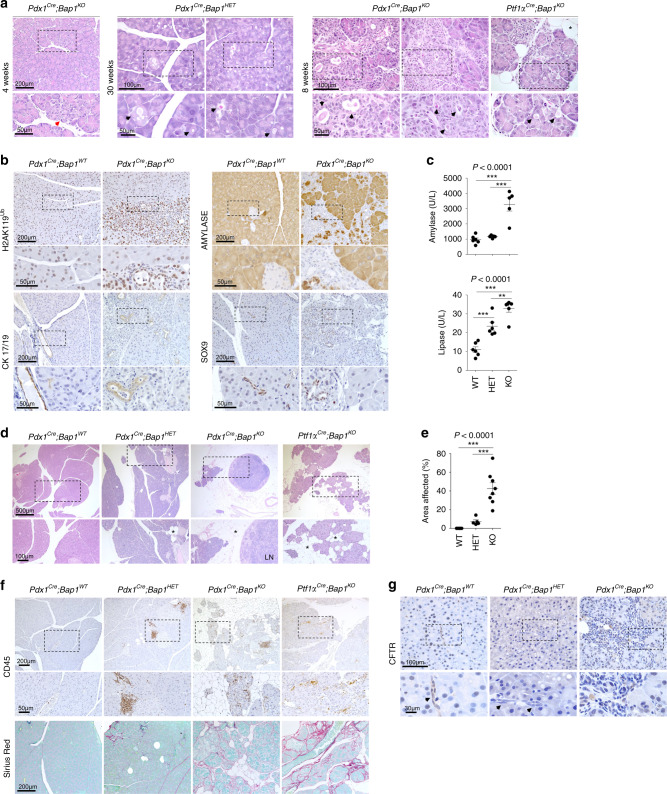
Fig. 2. BAP1 loss induces pancreatitis.
a H&E staining of pancreata from the indicated genotypes and ages. Red arrow points to an area with loss of acinar architecture and black arrows the accumulation of eosinophilic zymogen material and luminal dilation of acini. b IHC for the indicated markers in wild-type and Bap1-knockout mice at 8–10 weeks of age. The Pdx1Cre strain expresses Cre recombinase in a stochastic pattern causing mosaic histological alterations due to loss of Bap1. c Scatter dot plots (mean ± SEM) show serum amylase and lipase levels in 25–30-week-old mice of the indicated genotypes. (Amylase: WT n = 6, HET n = 5, and KO n = 5 mice. Lipase: WT n = 6, HET n = 6, and KO n = 6 mice). d H&E staining of 30-week-old pancreata of the indicated genotypes. Asterisks indicate saponification. LN, lymph node. e Scatter dot plot (mean ± SEM) showing the percentage of affected area in 30-week-old pancreata of the indicated genotypes (WT n = 6, HET = 5, KO n = 8 mice). f IHC for CD45 (top) and Sirius Red staining (bottom) showing leukocyte infiltration and collagen deposition, respectively, into the pancreatic parenchyma of 30-week-old wild-type and Bap1-deficient mice. g IHC for CFTR in 8–10-week-old wild-type and Bap1-deficient mice. Arrows point to ducts. In c and e, statistical significance was determined by one-way ANOVA with p-values shown on the top of each plot, followed by Tukey’s multiple comparison post-hoc test between groups test. **p < 0.01; ***p < 0.001. Source data are provided as a Source Data file.

