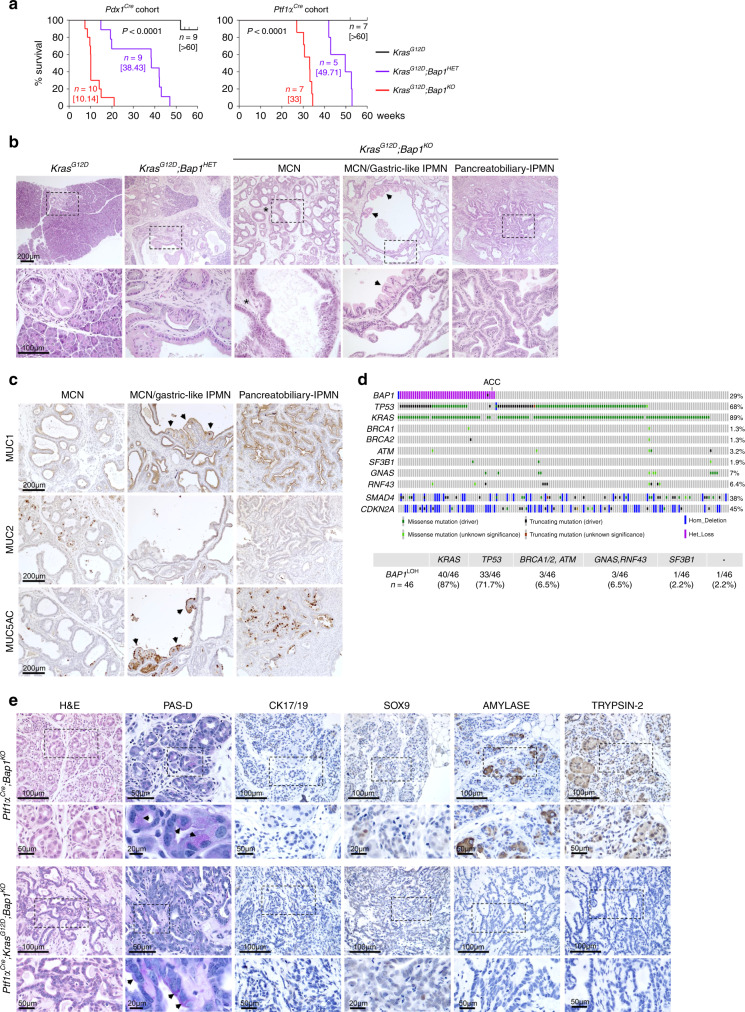
Fig. 4. BAP1 restrains KRASG12D driven pancreatic cancer.
a Kaplan–Meier plots showing the survival of mice of the indicated genotypes in the Pdx1Cre;KrasG12D (left) and Ptf1αCre;KrasG12D (right) cohorts. Median survival is shown in brackets. The Log-rank (Mantel–Cox) test was used to assess statistical significance between groups. n, number of mice. b H&E staining of 10–15-week-old pancreata from the Pdx1Cre cohort lacking Bap1 with histological alterations resembling mucinous cystic neoplasms (MCNs) and intraductal papillary mucinous neoplasms (IPMNs). Asterisks indicate ovarian type stroma lined by mucin-producing cells in MCN and arrows point to the foveolar epithelium. c IHC for the indicated mucins in Pdx1Cre;KrasG12D;Bap1KO tumors isolated from 10- to 15-week-old mice. Arrows point to areas of the foveolar epithelium. d Top: Oncoprint showing the overlap between heterozygous loss of BAP1 and mutations in the indicated oncogenes and tumor suppressors in the TCGA-PAAD cohort. Bottom: Table showing the percentage of patients with heterozygous loss of BAP1 and mutations in the indicated genes. ACC, acinar cell carcinoma. e H&E, Periodic Acid–Schiff staining with Diastase digestion (PAS-D) and IHC for ductal (Cytokeratin 17/19 and Sox9) and acinar (Amylase and Trypsin-2) markers in 25–30-week-old mice of the indicated genotypes. Arrows point to PAS-D-positive cytoplasmic staining of cells in areas with histological features resembling ACC. Source data are provided as a Source Data file.

