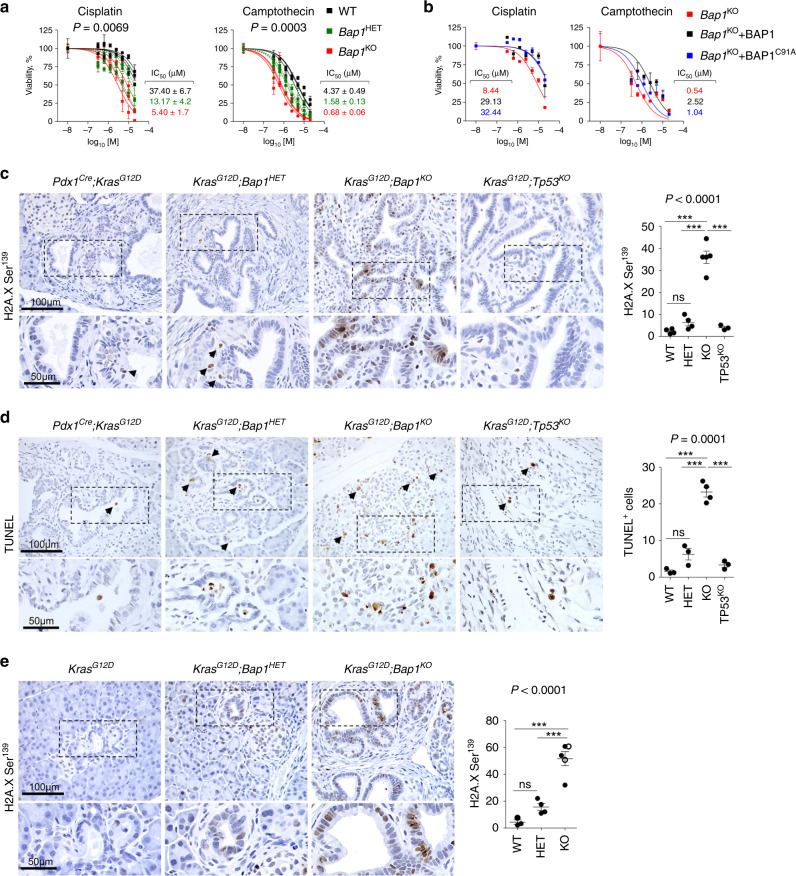
Fig. 7. BAP1 deficiency confers radio- and chemo-sensitivity.
a Estimation of IC50 values for cisplatin (left) and camptothecin (right) for wild-type (n = 3), heterozygous (n = 3), and Bap1-knockout (n = 3) pancreatic cell lines independently established from the Pdx1Cre;KrasG12D cohort and assessed in triplicates. The average IC50 values (mean ± SEM) are shown. Statistical significance was determined by one-way ANOVA with p-values shown on the top of each plot. b Estimation of IC50 values for cisplatin (left) and camptothecin (right) for a Bap1-knockout pancreas cell line reconstituted with wild-type and BAP1C91A mutant. The graphs show cell viability assessed in triplicates (mean ± SEM) for the indicated concentrations of compounds. c, d 10–15-week-old mice of the indicated genotypes were exposed to 10 Gy of IR. Three days later, mice were killed and pancreata were stained for (c) H2AXSer139 (WT n = 4, HET n = 4, KO n = 5, and TP53KO n = 3 mice) and (d) TUNEL (WT n = 3, HET n = 3, KO n = 4, and TP53KO n = 3 mice). e 6–10-week-old mice of the indicated genotype (WT n = 3, HET n = 4, and KO n = 5 mice) were treated weekly for 4 weeks with 5 mg/kg cisplatin. Mice were killed and pancreata were stained for H2AXSer139. In c–e, the scatter dot plots show the number of positive cells (mean ± SEM) per 0.1 mm2 of tissue per mouse. Each dot represents a mouse. Black arrows point to positively stained cells. Filled and open circles indicate mice from the Pdx1Cre and Ptf1αCre cohorts, respectively. Statistical significance was determined by one-way ANOVA with p-values shown on the top of each plot, followed by Tukey’s multiple comparison post-hoc test between groups. ns, nonsignificant; ***p < 0.001. Source data are provided as a Source Data file.

