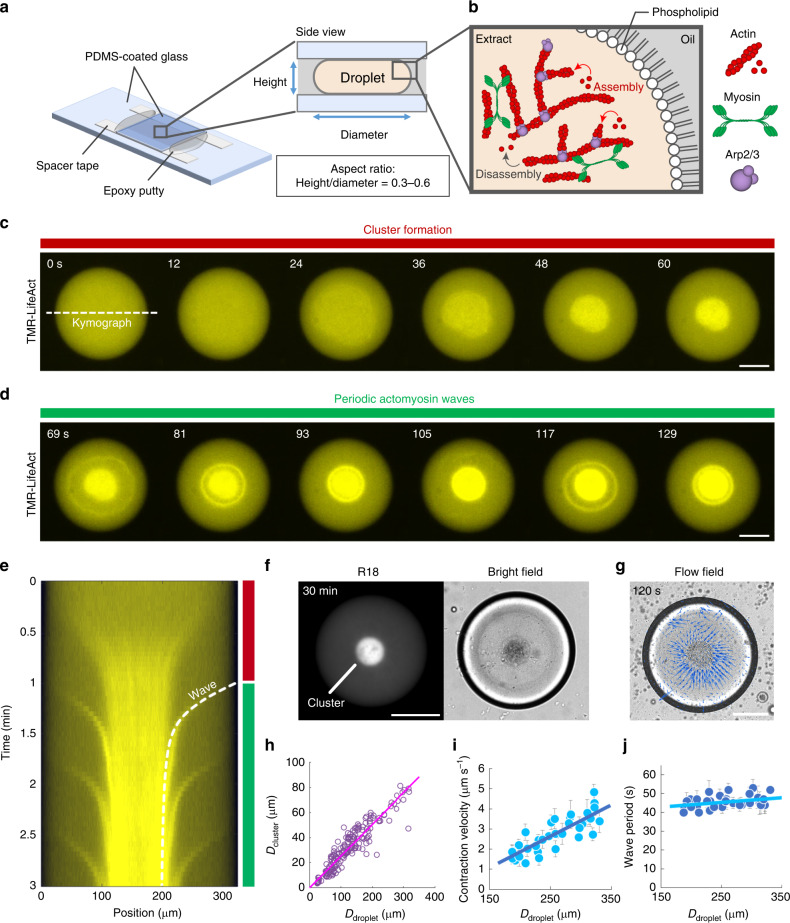
Fig. 1. Cell-sized confinement induces cluster formation and periodic actomyosin waves.
a Schematic illustration of the experimental setup. The extract-in-oil droplets were confined in a quasi-two-dimensional space between two polydimethyl siloxane (PDMS)-coated glass slides. The aspect ratio of the height to diameter was fixed at 0.3–0.6. b Magnified view of the droplet boundary. The droplet was surrounded by a single layer of natural phospholipids to mimic the cell boundary. Actin filaments are nucleated by the Arp2/3 complex. Myosin induces actin network contraction. c–e Time-lapse images of F-actin dynamics in the extract-in-oil droplet, showing c initial contraction of the F-actin network, followed by d periodic wave propagation, and e the kymograph (Supplementary Movie 1). The broken line shows the theoretical model of the actomyosin wave (Supplementary Note 1). Actin filaments were visualized by tetramethylrhodamine (TMR)-LifeAct. The droplet temperature was elevated from 0 to 20 °C at 0 s to initiate actin polymerization. Periodic actomyosin waves persisted for more than 90 min (Supplementary Movie 2). We performed >10 independent experiments and confirmed the repeatability. f Fluorescence and the bright-field images of organelles stained with Octadecyl Rhodamine B chloride (R18). Organelles were accumulated by the initial contraction of the actomyosin network, forming a single nucleus-like spherical body (called a “cluster”). g Velocity field of the actomyosin wave visualized by particle imaging velocimetry. The same sample as c and d was analyzed. h Relationship between the cluster diameter Dcluster and the droplet diameter Ddroplet (n = 176). The plot was fitted by Dcluster = 0.25Ddroplet (R2 = 0.86; R-squared value for linear regression). We performed two independent experiments. i, j Initial contraction velocity v and period of the wave T displayed along the droplet diameter Ddroplet (n = 35). The plots were fitted by v = 1.6 × 10⁻²Ddroplet − 1.3 (R2 = 0.69) and T = 2.5 × 10⁻²Ddroplet + 39 (R2 = 0.12), respectively. Error bars represent standard deviations from the mean velocities and mean periods averaged over three successive waves and wave periods, respectively. We performed two independent experiments. Scale bars, 100 μm.

