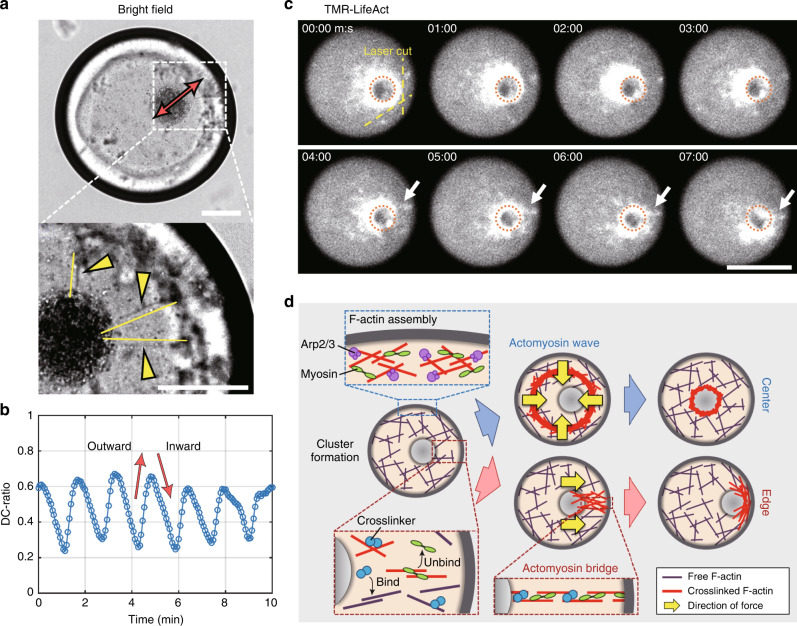
Fig. 4. Actomyosin bridges pull the cluster toward the droplet boundary.
a, b Oscillatory motion of the cluster (Supplementary Movie 12). a Snapshot images of the droplet showing the oscillatory motion. (Top) The direction of motion of the cluster is indicated by the red double-sided arrow. (Bottom) The bridges connecting the cluster and the boundary are indicated by yellow arrow heads. b Time course of the cluster motion shown in a. c Actomyosin bridges formed between the cluster and the droplet boundary were cut by a UV pulsed laser. After the laser ablation, the cluster began to move back to the droplet center. After 4 min has passed, the cluster began to move to the edge again. In the same time, actomyosin bridges reassembled (white arrow). The original position of the cluster is indicated by the red broken circle (Supplementary Movie 14). d The tug-of-war model. (Top) Actomyosin waves push the cluster to the droplet center in every wave period. A magnified view showing F-actin polymerization nucleated by the Arp2/3 complex. (Bottom) Between periodic actomyosin waves, if actomyosin bridges are formed, network contraction pulls the cluster to the edge. A magnified view showing the dynamics of bulk actomyosin between periodic actomyosin waves. If inter-connected actomyosin bridges are formed between the cluster and the droplet boundary, the cluster is contracted toward the edge. Scale bars, 50 μm.

