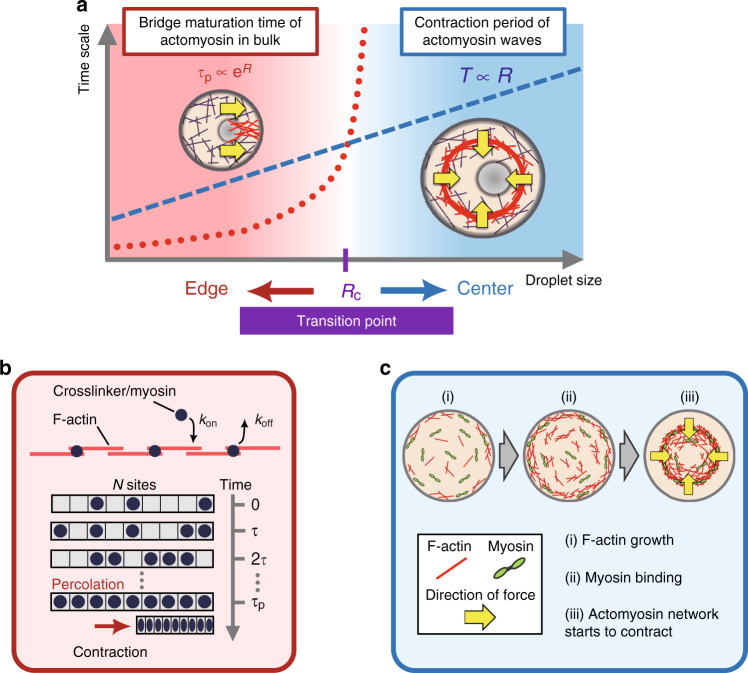
Fig. 6. Theoretical modeling of the two-state cluster positioning.
a The proposed mechanism underlying droplet size-dependent two-state cluster positioning. The red dotted curve and blue dashed line represent the bridge maturation time τp and the wave period T, respectively. Actomyosin waves transport the cluster toward the droplet center every period of T, while stochastically formed actomyosin bridges (mean maturation time τp) transport the cluster towards the droplet boundary. Actomyosin bridges are stochastically formed in the time period T between actomyosin waves. If bridges are formed, the network contraction pulls the cluster toward the droplet boundary until the subsequent wave collides with the cluster. Since the characteristic time-scales of two antagonistic forces have different size dependences, the transition radius Rc is determined by one unique crossover point. The resultant stable position is determined by the matured network faster than the other. b The percolation model of actomyosin bridge formation. We describe the stochastic binding/unbinding dynamics as the percolation process, wherein crosslinking sites are occupied by crosslinkers with a probability of 1/2 in every turnover time step τ. If all sites (the total number N) are occupied by crosslinkers, an actomyosin bridge is formed between the cluster and the droplet boundary, and the cluster is transported toward the droplet boundary via actomyosin bridge contraction. The mean percolation time τp is defined as the number of time steps necessary to form the actomyosin bridge on average, and kon and koff indicate the binding and unbinding rates of crosslinkers, respectively. c An active gel model of periodic actomyosin wave formation. The wave period is determined by the sum of three sequential processes: (i) actin network formation by F-actin growth, (ii) stress generation by myosin binding, and (iii) the ring starts to contract toward droplet center.

