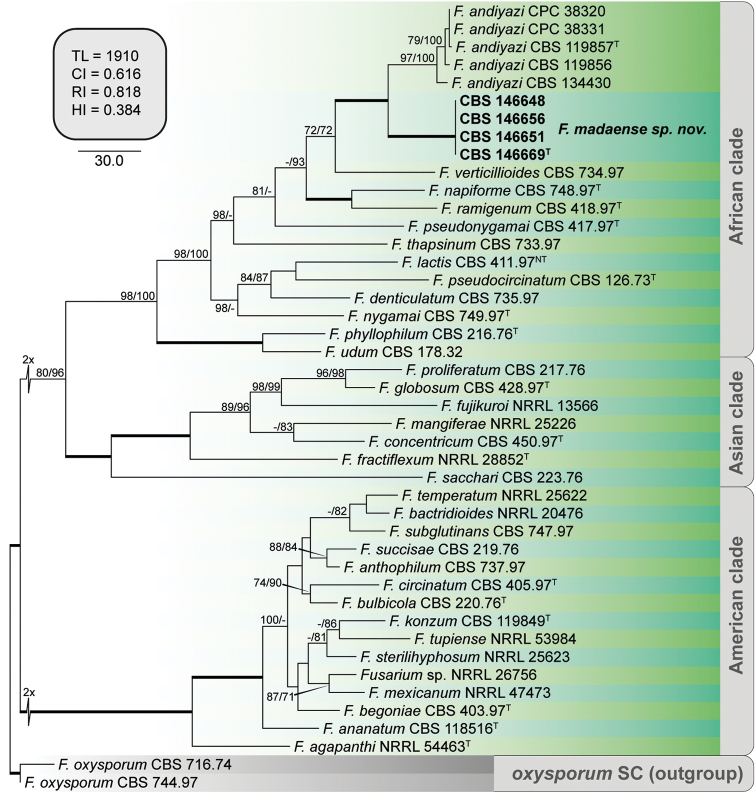
Figure 4.
The first of 24 equally parsimonious trees obtained from Maximum-Parsimony (MP) analysis of BenA, CaM, RPB1, RPB2 and TEF-1a sequences of 42 isolates of Fusarium spp. Numbers on the nodes are MP bootstrap values (BS) and Maximum-Likelihood BS values above 70%. Branch lengths are proportional to distance. Ex-type strains are indicated with T. Strains corresponding to new species described here are shown in bold. The internal square shows MP statistics as follows: TL = tree length, CI = consistency index, RI = retention index and HI = homoplasy index.

