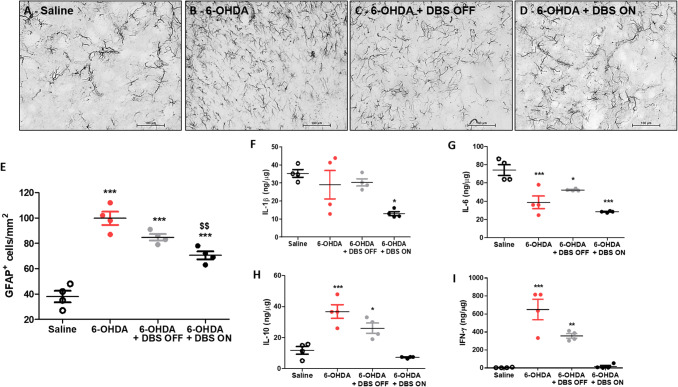
Fig. 2.
Pallidal inflammation following STN–DBS in vivo. a–d Photomicrographs of immunoreactivity for GFAP in saline (a), 6-OHDA (b), 6-OHDA + DBS OFF, (c) and 6-OHDA + DBS ON (d) and e quantification of GFAP + cells in the GP (n = 4). f–i In vivo evaluation of expression levels of IL-1β (f), IL-6 (g), IL-10, (h) and IFN-γ (i) in the GP. Values represent the mean + SEM of four independent experiments. *p < 0.05; **p < 0.001, ***p < 0.0001 vs. saline-injected control animals. $$p < 0.001 vs. 6-OHDA group

