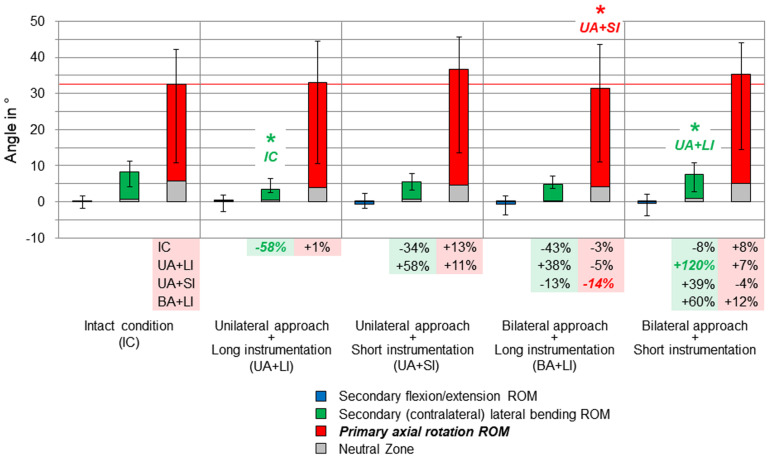
FIGURE 5.
Results for primary axial rotation movement of the entire thoracic spine (T1–T12), illustrated as medians with ranges, respectively. Significant differences (p < 0.05) are labeled with an asterisk as well as the respective condition to which the ROM median value was significant. Relative ROM changes between the single conditions are given at the bottom of the diagram for primary axial rotation and secondary lateral bending. The red horizontal line indicates the median value of the intact condition.

