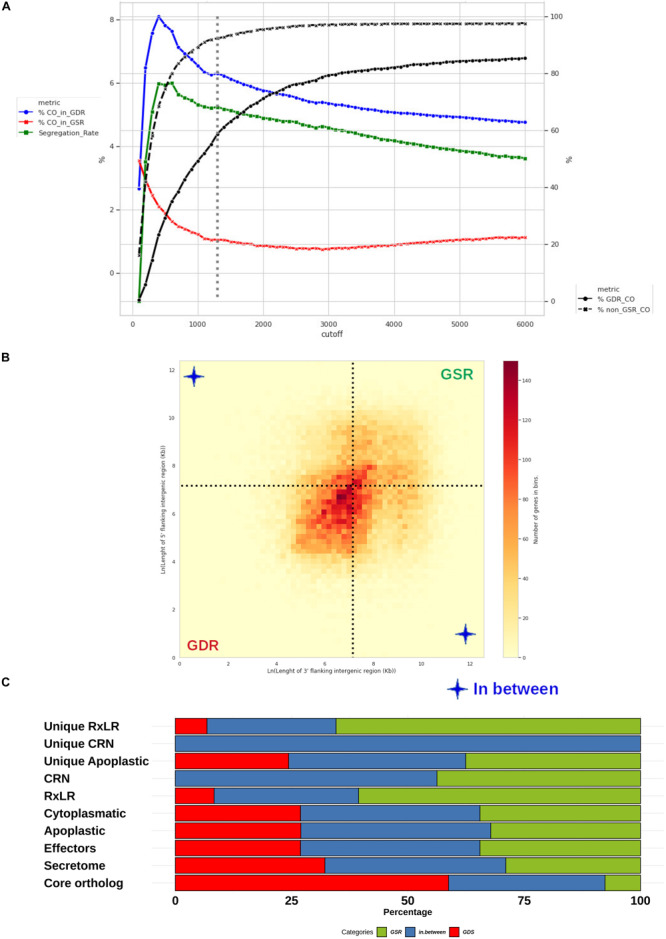
FIGURE 10.

Distribution of Phytophthora betacei genes according to the length of their FIRs. Delimitation and effector content of P. betacei gene sparse regions (GSRs) (A) Simulation of core ortholog gene segregation. Genes with both FIRs longer than a value “L” were considered to be present in a gene-sparse region (GSR), whereas genes with both FIRs below L were considered to belong to a gene-dense region (GDR). The percentage of core orthologs in GDRs (%CO_in_GDR) (blue line), the percentage of core orthologs in GSRs (%CO_in_GSR) (red line) and segregation rate (green line) were calculated for a specific cutoff L value. The core ortholog genes segregation rate was defined as the difference between %CO_in_GDR (blue line) and %CO_in_GSR (red line). The highest core ortholog genes segregation rate in which the percentage of core ortholog genes classified as sparse was less than 10% was obtained for L = 1.3 Kb (dotted lines) (B) Distribution of P. betacei genes according to the length of their FIRs. All P. betacei predicted genes were sorted into 2-variable bins according to their 3’FIR (Y-axis) and 5’FIR (X-axis). The 1.3 Kbp limit for GSRs genes (dotted lines) delimits three groups of genes: genes found in GDRs, GSRs, and In-between regions. (C) Distribution of gene groups into the GDRs and GSRs of P. betacei. The proportion of secretome, effectors, RXLR core effector genes, CRN core effector genes and the unique RxLR/CRN that occur in GSRs (green), GDRs (red) and in between (blue) are shown.
