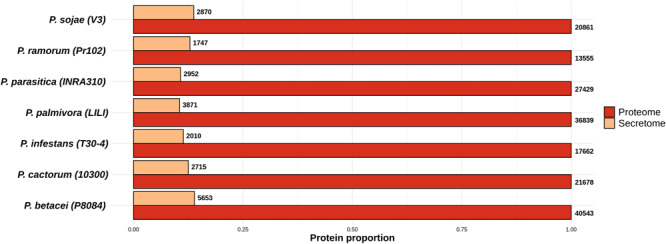
FIGURE 2.

Proportion of the predicted secretomes relative to the proteomes of the Phytophthora species evaluated. Proportion of secreted proteins relative to the total proteome for all Phytophthora species evaluated. Numbers at the end of each bar indicate the number of proteins predicted in the secretome and proteome of each species. Data were normalized to the size of proteome.
