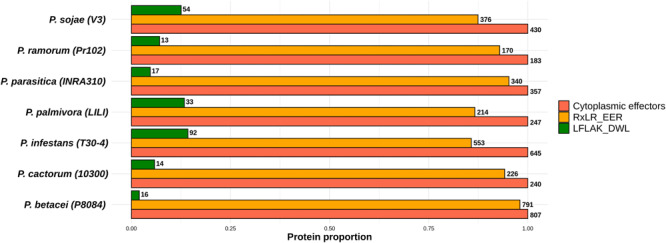
FIGURE 7.

Proportion of effectors with RxLR_EER and LXLFLAK_DWL (CRNs) motifs relative to the total amount of predicted cytoplasmic proteins. Numbers at the end of each bar indicate the number of proteins predicted for each effector category (RxLR and LFLAK). Data were normalized to the number of cytoplasmic effectors.
