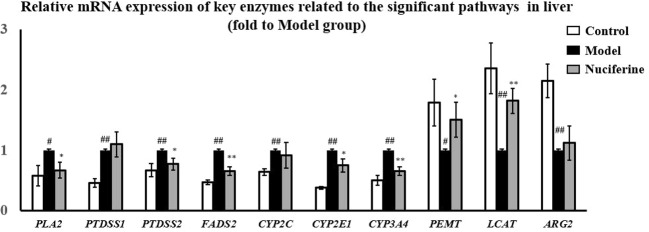
Figure 8.
Gene expression of PLA2, PTDSS2, FADS2, CYP2E1, and CYP3A4 was downregulated, while PEMT and LCAT was upregulated in liver after nuciferine treatment (fold to experimental model group). Control, experimental model, and nuciferine-treated (n = 6 per group) groups. Data are presented as mean ± SD. #p < 0.05 as compared to the control group; ##p < 0.01 as compared to the control group; *p < 0.05 as compared to the experimental model group; **p < 0.01 as compared to the experimental model group.

