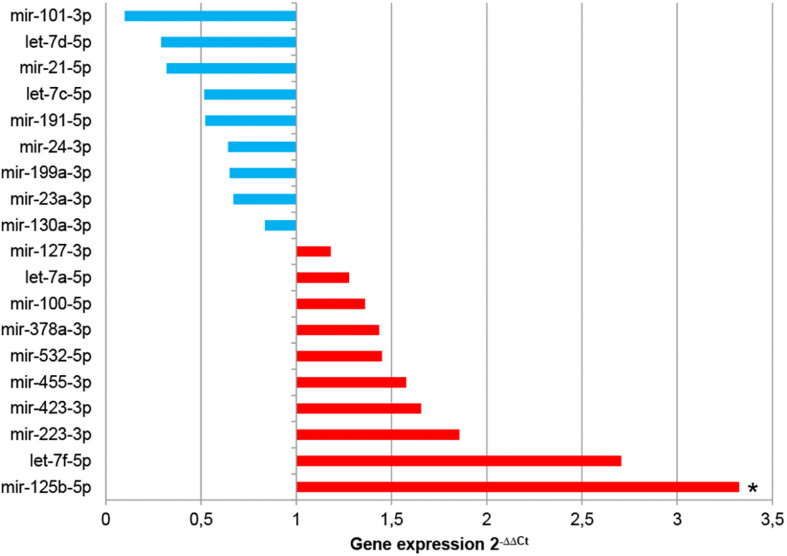
FIGURE 6.
Comparative analysis of miRNA expression between EV-CDCs and IFNγ/EV-CDCs. The comparative analysis of miRNA expression was performed by qPCR. Total RNA was isolated from EV-CDCs and IFNγ/EV-CDCs, and amplification products were compared by the 2–ΔΔCt method using the most stable miRNAs as endogenous controls. The statistical analysis was performed using a Thermo Fisher Cloud Analysis version 1.1. Graphs show 2–ΔΔCt. *p ≤ 0.05.

