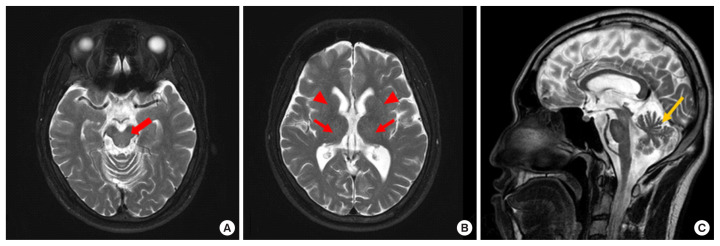
Fig. 1.
T2-weighted magnetic resonance images of the patient. (A) The axial image does not show high signal intensity in the midbrain (red arrow). (B) The axial image does not show high signal intensity in the thalamus (red arrows) or putamen (red arrowheads).(C) The sagittal image shows cerebellar atrophy (yellow arrow).

