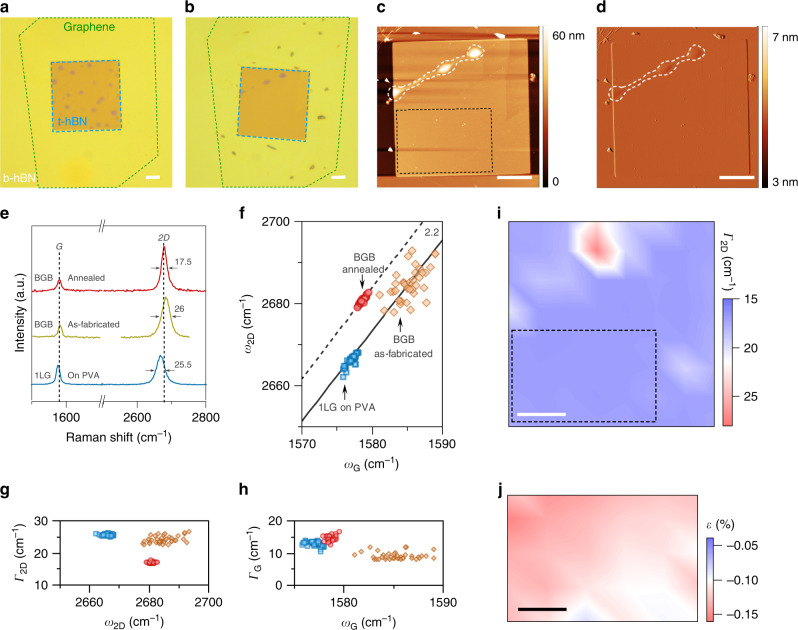
Fig. 3. Evaluation of graphene material quality.
Optical images of a BGB stack a after lamination (i.e., as-fabricated) and b after UHV annealing, indicating the effectiveness of the annealing step in removing blisters. High-resolution c AFM topography and d AFM topography error images confirm the cleanliness of the annealed BGB stack. Notice the remaining blisters in the top left corner of the AFM images. The black dashed box represents the region, which we used for comparing the Raman data before and after UHV annealing. e Typical Raman spectra of monolayer graphene (1LG) obtained at the different stages of the BGB stack fabrication. The black dashed lines mark the position of G and 2D lines after UHV annealing. The numbers next to the 2D lines give the FWHM. f The plot of ω2D against ωG. The dashed and solid black lines have a slope of 2.2. The scatter plots of (g) Γ2D against ω2D, and h ΓG against ωG. The symbols in these two plots correspond to the data in the f. i The spatial map of Γ2D of the annealed BGB stack, confirming the ability of Raman to provide precise information about the location of blisters. The black dashed box in this plot is the same region as in the AFM image of the c. j The estimated strain amplitude in the marked rectangular region. All scale bars are 5 μm.

