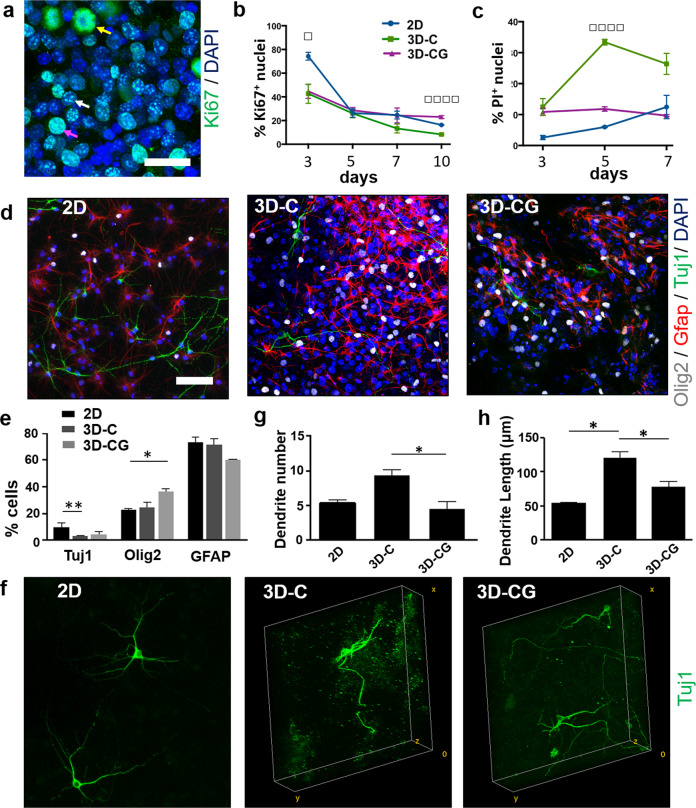
Fig. 2. Regulation of NSC proliferation, viability, and differentiation by PCS composition in vitro.
a Fluorescence image of Ki67+ NSCs inside a porous collagen-GAG scaffold at 3 DIV. Arrows highlight cells at the early S phase (white arrow), the late S phase (purple arrow), or mitosis (yellow arrow). Scale bar, 30 μm. b Fraction of Ki67+ nuclei in the three NSC culture groups at 1, 3, 5, 7, and 10 DIV (n = 3). c Fraction of PI+ nuclei in the three NSC culture groups at 1, 3, 5, and 7 DIV (n = 3). d Representative confocal images of cells immunostained for Tuj1 (neurons; green), Olig2 (oligodendrocytes; gray), and Glial fibrillary acidic protein (GFAP, astrocytes; red) in 2D, 3D-C, and 3D-CG cultures at 7 DIV. Scale bar, 50 μm. e Fractions of Tuj1+, Olig2+, and GFAP+ cells in the three cell culture groups at 7 DIV. f 3D reconstruction of confocal z-stacks of NSC-derived Tuj1+ neurons growing on laminin-coated coverslips (2D) or inside porous scaffolds (3D-C, 3D-CG) at 7 DIV. Box size: 263 × 263 × 80 μm. g Number of dendrites per Tuj1+ neuron in the three NSC culture groups (n = 30). h Mean dendrite length per Tuj1+ neuron in the three NSC culture groups (n = 30). Results are expressed as mean ± SEM. *P < 0.05, **P < 0.01, □P1-way-ANOVA < 0.05, □□□□P1-way-ANOVA < 0.001.

