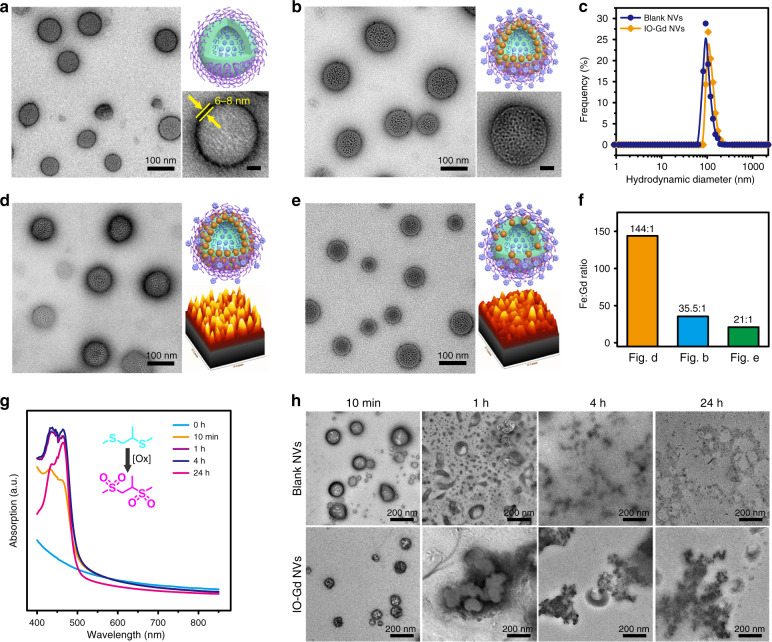
Fig. 2. Characterizations of ROS-responsive IO-Gd NVs.
a TEM image, cartoon image (upper right), and magnified TEM image (lower right, scale bar 20 nm) of the blank NVs. The membrane thickness of the blank NVs is about 6–8 nm. b TEM image, cartoon image (upper right), and magnified TEM image (lower right, scale bar 20 nm) of the IO-Gd NVs (Fe:Gd = 35.5:1). c DLS measurements of the blank NVs and the IO-Gd NVs. d–f TEM images and column analysis of the IO-Gd NVs with different Fe:Gd molar ratios. Insets show the cartoon figure and intensity-based analysis of the distribution of IO NPs according to the TEM image, respectively. g Time-dependent UV–vis absorption of the blank NVs incubated with NaCl, MPO (5 U/mL), and H2O2 (500 μM). h TEM images of the blank NVs and the IO-Gd NVs incubated with NaCl, MPO (5 U/mL), and H2O2 (500 μM) at different time points.

