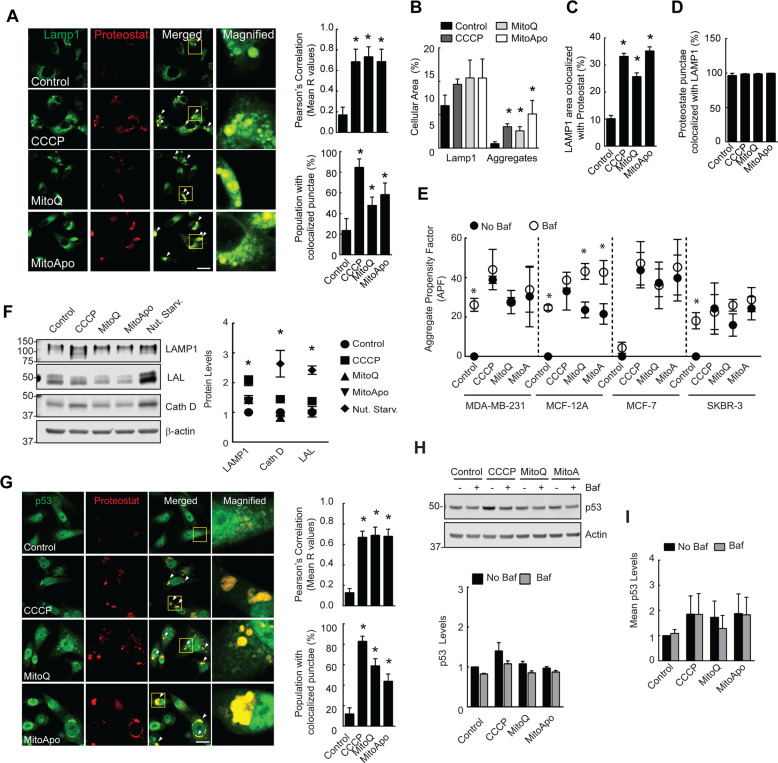
Fig. 2. Mitochondrial dysfunction generated p53 positive aggregates that resist lysosomal degradation.
a Fluorescent images of LAMP1 and Proteostat punctae in MDA-MB-231 cells exposed to mitochondrial damaging agents. Graphs show the Pearson’s R values. (n = 4–8 fields) (b–d) Quantification of the (b) LAMP1 or Proteostat stained areas, (c) LAMP1 stained area with Proteostat and (d) Proteostat stained area with LAMP1 overlapping. (n = 4–8 fields, *p < 0.05 as indicated by Tukey’s post-hoc test as compared to the respective stain control cells). (e) Cells were exposed to DMSO, CCCP, MitoQ, and MitoApo in the presence or absence of Bafilomycin (5 nM) for 24 h to determine the APF using FACS analysis. (n = 4–5). f Immunoblots of LAMP1, Cath D, and LAL from MDA-MB-231 cells after 24 h of nutrient starvation or treatment (n = 7). g Immunofluorescent images of p53 in Proteostat-stained MDA-MB-231 cells subjected to CCCP, MitoQ and MitoApo for 24 h. Graphs are the Pearson’s Correlation (R values shown) of whole cells and the population percentage positive for colocalized punctae. (ANOVA, n = 3–7 fields, *p < 0.05 as indicated by Tukey’s post-hoc test as compared to the control). h Representative immunoblot of p53 from MDA-MB-231 cells after 24 h of CCCP, MitoQ, and MitoApo treatment in the presence and absence of Baf (n = 3, *p < 0.05 as indicated by Tukey’s post-hoc test as compared to the control) (i) Mean p53 fluorescence in cells treated with different mitochondrially targeted agents for 24 h in the presence and absence of Baf. (n = 3) using FACS. Bars represents the mean and error bars are standard deviation. Bars and dots represent the mean, while error bars are standard deviation. *p > 0.05 as according to Tukey’s post-hoc test.

