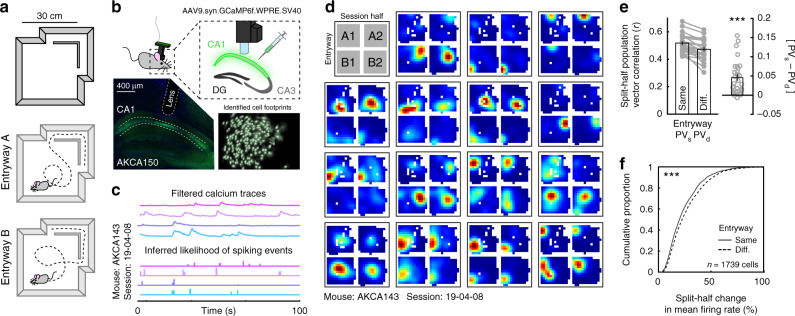
Fig. 1. The CA1 rate code depends on entryway.
a Schematic of the recording environment. b One-photon calcium recording setup, with an example of viral expression (lower left) and the spatial footprints of cells extracted from the in vivo recorded calcium signal for an example session (lower right). c Example of extracted filtered calcium traces (top) and the resulting inferred likelihood of spiking events (bottom). d Example rate maps from 15 simultaneously recorded place cells when the data are divided by most recent entryway and session half. Rate maps are normalized from zero (blue) to the peak (red) across all four maps. e Split-half correlations of population activity within the compartment when the mouse entered from the same versus the different entryway. Each dot represents one session from one mouse. Data are from 29 sessions from 5 mice. Correlations were significantly higher when the mouse entered from the same entryway (Wilcoxon signed-rank test: Z = 4.573, p = 4.80e–6). f Cumulative distribution of split-half changes of mean firing rates within the compartment when the mouse entered from the same versus the different entryway. Mean firing rates were significantly more similar when the mouse entered from the same entryway (Wilcoxon rank-sum test: Z = 4.209, p = 2.56e–5). All bar graphs reflect mean ± 1 SEM; p-values are uncorrected and two-sided. Data from (e, f) provided as Source data file. ***p < 0.001.

