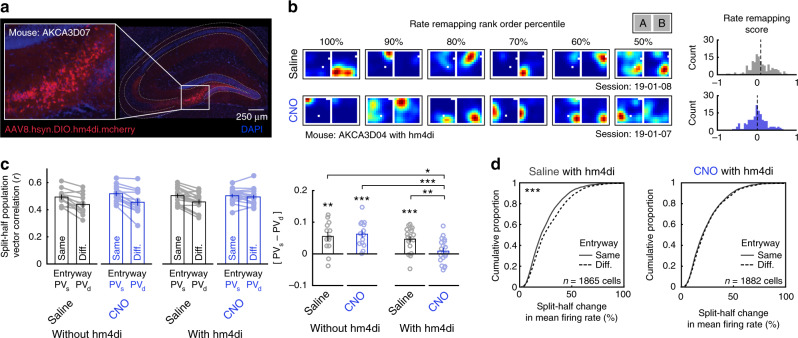
Fig. 4. Inhibition of DG–CA3 circuitry eliminates remapping of the CA1 rate code.
a Representative example of cre-mediated hm4di-mcherry transfection in left dorsal DG and CA3 (see Supplementary Fig. 18 for additional examples and quantification details). b Six example rate maps of simultaneously recorded place cells from consecutive Saline/CNO sessions selected and ordered by their rate remapping score rank (left). Rate maps are normalized from zero (blue) to the peak (red) across both maps. Distribution of rate remapping scores and mean score for these example sessions (right). Rate remapping score defined as split-half change in mean firing rate for different minus same entryway. c Split-half correlations of population activity within the compartment when the mouse entered from the same versus the different entryway for all conditions. Correlations were significantly higher when the mouse entered from the same entryway in all conditions except for CNO with hm4di (Wilcoxon signed-rank test: without hm4di Saline: p = 0.0046; without hm4di CNO: p = 1.2e−4; with hm4di Saline: Z = 3.380; p = 7.2e−4; with hm4di CNO: Z = 0.9256, p = 0.355). Correlation differences were significantly lower in the CNO with hm4di condition than all other conditions (Wilcoxon rank-sum tests: without hm4di Saline versus without hm4di CNO: Z = 0.267, p = 0.790; without hm4di Saline versus with hm4di Saline: Z = 0.691, p = 0.490; without hm4di CNO versus with hm4di Saline: Z = 1.147, p = 0.251; without hm4di Saline versus with hm4di CNO: Z = 2.379, p = 0.017; without hm4di CNO versus with hm4di CNO: Z = 3.479, p = 5.0e−4; with hm4di Saline versus with hm4di CNO: Z = 2.861, p = 4.2e−3). d Cumulative distribution of split-half changes of mean firing rates within the compartment when the mouse entered from the same versus the different entryway for mice with hm4di. Mean firing rates were significantly more similar when the mouse entered from the same entryway during Saline sessions (Wilcoxon signed-rank test: Z = 5.052, p = 4.4e−7), but not during CNO sessions (Z = 1.024, p = 0.306). All bar graphs reflect mean ± 1 SEM; p-values are uncorrected and two-sided. Data from (c, d) provided as Source data file. *p < 0.05, **p < 0.01, ***p < 0.001.

