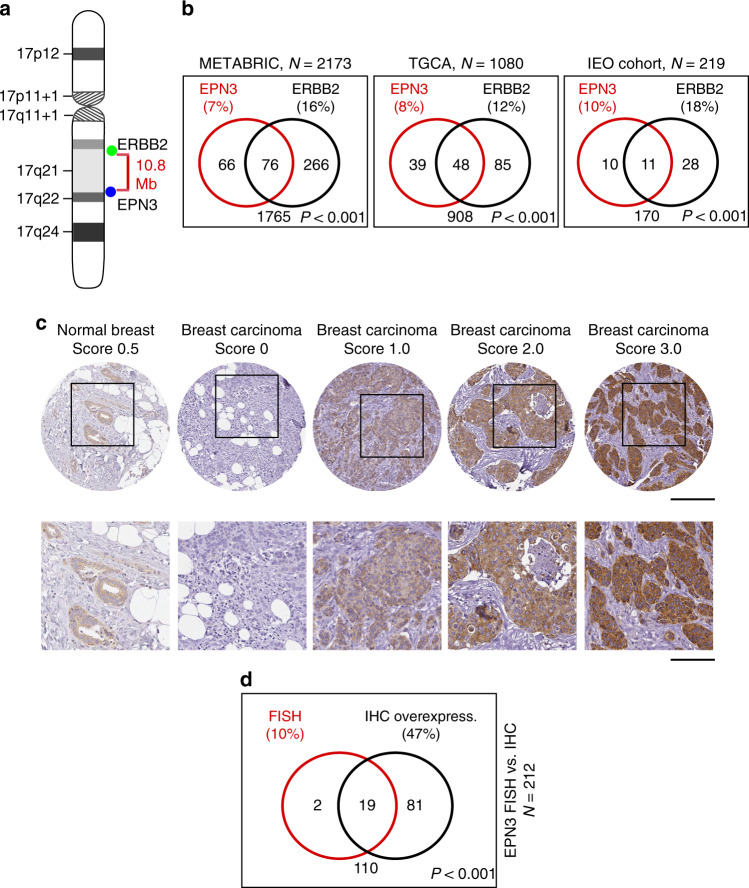
Fig. 1. Amplification/overexpression of EPN3 in human BCs.
a Schematic representation of human chromosome 17. b Venn diagram of EPN3 and ERBB2 amplification in different BC cohorts: BC METABRIC cohort (N = 2137, available at http://www.cbioportal.org)71,72, TCGA invasive BC cohort (N = 1080, TCGA Research Network: http://cancergenome.nih.gov/), and the IEO cohort (N = 219). Percentage (%) of amplification is shown in parentheses. In the IEO cohort, EPN3 and ERBB2 were considered amplified when the EPN3/CEP17 ratio was >2.5, and the ERBB2/CEP17 ratio was ≥2.060, respectively. P, P value of the association between the indicated variables by two-sided Fisher’s exact test. c Representative images of EPN3 IHC (quantification scores are indicated). Top, images at 20× (bar, 200 μm); bottom, magnification of the boxed insets (bar, 200 μm). d Venn diagram representation of EPN3 amplification (FISH) and overexpression (IHC; score >1.0) in the IEO cohort (N = 212). P, P value of the association between the indicated variables by two-sided Fisher’s exact test. Source data are provided as a Source Data file.

