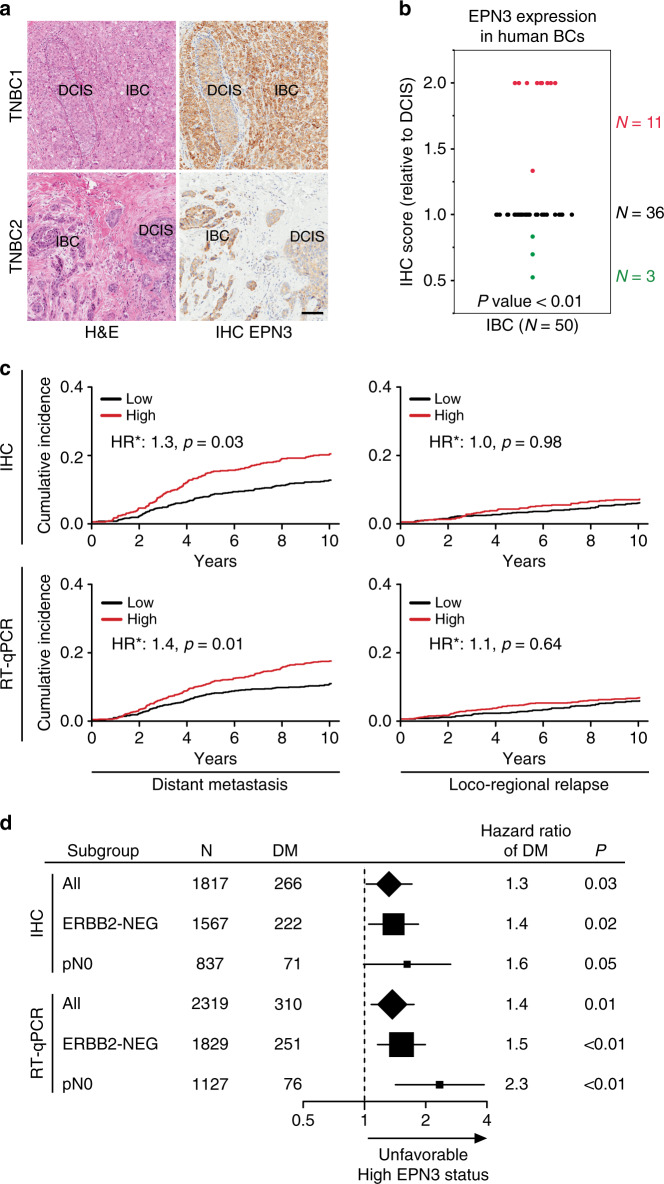
Fig. 10. High EPN3 levels correlate with IBC and independently predict metastasis.
a H&E staining and EPN3 IHC images of in situ (DCIS) and adjacent infiltrating area (IBC) detected in two different primary human BCs. Images at ×20. Bar, 100 µm. b Summary graph of the differential expression of EPN3 detected by IHC in human BC samples in areas of DCIS vs. adjacent IBC. Data are reported as IHC score in IBC relative to DCIS. N, number of tumor samples. P value, two-sided Wilcoxon signed-rank test. c Cumulative incidence of distant metastasis or loco-regional relapse in BC patients of the IEO consecutive cohort (IEO BC 97-00, N = 2453), stratified by EPN3 protein (top, IHC) or mRNA (bottom, RT-qPCR) levels. HR*, multivariable hazard ratio. Multivariable models were adjusted for tumor grade, tumor size, Ki-67 levels, ERBB2 status, ER/PR status, number of positive lymph nodes, and age at surgery, see Supplementary Table 3. d Forest plot of the multivariable hazard ratios of distant metastasis and 95% Wald confidence intervals (whiskers) in the entire cohort of patients (All) and in the ERBB2-negative (ERBB2-NEG) or lymph node-negative (pN0) subgroups of patients stratified by EPN3 protein (IHC) or mRNA (RT-qPCR) expression levels. The size of the solid squares and diamonds is proportional to the number of distant metastases. The number (N) of patients and distant metastases (DM) in each group is indicated. Hazard ratios were estimated with a Cox proportional hazards multivariable model, adjusted for Grade, Ki-67, ERBB2 status, estrogen/progesterone receptor status, tumor size (pT), number of positive lymph nodes (pN), and age at surgery (as appropriate). The number of patients in each subgroup analysis corresponds to those reported in Supplementary Tables 1 and 2 for IHC and RT-qPCR, respectively. P value, Wald test P value. See also Supplementary Tables 1–314. Source data are provided as a Source Data file.

